Download
1 / 33
330 likes | 493 Views
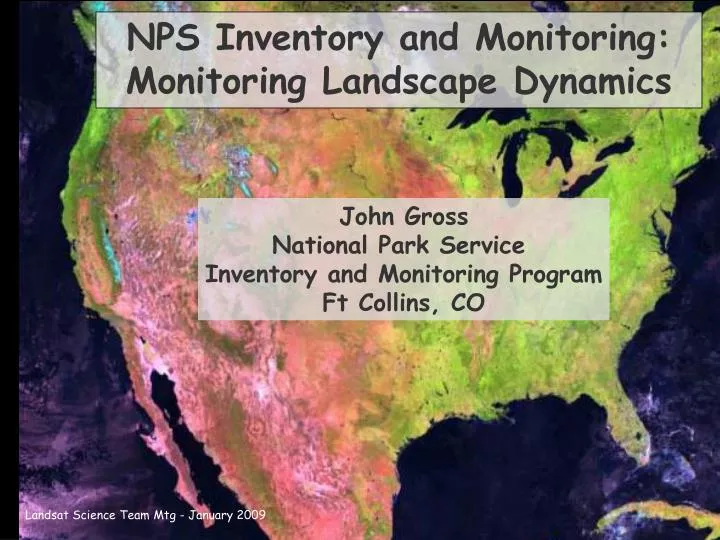
NPS Inventory and Monitoring: Monitoring Landscape Dynamics. John Gross National Park Service Inventory and Monitoring Program Ft Collins, CO. Landsat Science Team Mtg - January 2009. Road map …. Overview of NPS I&M program I&M landscape dynamics monitoring Past Current Future.

E N D
NPS Inventory and Monitoring: Monitoring Landscape Dynamics John Gross National Park Service Inventory and Monitoring Program Ft Collins, CO Landsat Science Team Mtg - January 2009
Road map … • Overview of NPS I&M program • I&M landscape dynamics monitoring • Past • Current • Future
State of the Parks Report (circa 2000) • 80 (1/3) of the “natural resource parks” had no professional natural resource manager; 1/3 had only 1 or 2 natural resource professionals. • Almost all projects/studies were short-term; staff focused on “crisis of the day”. • Emphasis on data collection; little analysis or reporting; data & products difficult to find or use • Science products mostly used by other scientists No Time No Money No Clue
National Park Service Natural Resource Challenge - 2000 Revitalize and expand the natural resource program within the park service and improve park management through greater reliance on scientific knowledge
I&M Program Goals Establish inventory and monitoring as a standard practice throughout the NPS … Inventory the natural resources ... Monitor park ecosystems ... Integrate natural resource information into NPS planning, management, and decision making. Share NPS accomplishments and information with others and form partnerships to attain common goals and objectives.
Overall Purpose of Vital Signs Monitoring: Determine status and trends in the condition of selected park resources The intent of vital signs monitoring is to track a subset of physical, chemical, and biological elements and processes of park ecosystems that represent the overall health or condition of park resources, known or hypothesized effects of stressors, or elements with important human values. Collect, Analyze, Report
The 32 park networks are an administrative tool for greater efficiency by sharing staff & funding. I&M serves ~ 280 park units
Most common vital signs include: • Landscape dynamics • Weather and climate • Invasive species • Water quality • Vegetation communities • Surface water dynamics, including snow • Air quality Landscape dynamics was identified as a priority vital sign by almost every I&M Network
Some key landscape monitoring activities • Workshops (2004; NARSEC 2005, 2007) • w/ NASA, Parks Canada, CCRS • Network-sponsored protocol development • Warren Cohen / Robert Kennedy • Andy Hansen • Phil Townsend et al. • Y.Q. Wang • Brad Reed • NASA projects • Jeff Morrisette – invasives • Andy Hansen et al.
What have we learned?? • Broad-scale analyses of landscape dynamics: • Common core variablesacross networks. • Potential to use inexpensive, widely-available data. • Change detection – may use inexpensive high-frequency, coarse-resolution data to strategically acquire expensive data. • Finer-scale landscape dynamics (e.g. vegetation change) • Commonalities more at regional to local scales • Many more network- or park-specific issues • Change detection is a very big issue
Two current, broader-scale efforts • NASA-NPS Project – PALMS • Hansen, Goetz, Theobald, Nemani, Melton, and Gross • Integration of RS data, ancillary data, models • Strong reliance on TOPS for ecosystem processes • Focused on four prototype parks
NASA-NPS - PALMS • Strengths in RS science • Working closely with parks to ID needs • Very strong modeling capabilities • Conceptual advancements (e.g., GPE) • Educating / informing NPS staff • State-of-the art web presence via TOPS • Sophisticated use of data, models, analyses • Hope to expand in the future
I&M - Monitoring Landscape Dynamics (MoLD) • Networks confronting reality – expensive & difficult • Real progress limited to a few Networks • To exploit efficiencies in: • Identifying measures • Acquiring and processing data • Interpreting & reporting core measures • Agency imperative to know about our parks • Consistency for regional to national reporting • Build on NASA project; much less sophisticated but more broadly applied
Overall Goal Identify, evaluate, and report a suite of landscape-scale measures for all I&M parks. Use measures to assess current status, threats, and conservation vulnerability and opportunity.
Project Scope: • Must rely on existing data at regional to national scales • Well established measures, e.g.: • area of land cover types • habitat pattern • impervious surfaces • housing density • major disturbances ?
Human Footprint / Drivers • Human population / housing • Roads • Impervious surface • Hydrological impoundments • Agricultural lands • Natural Systems • Area of habitats • Core area • Connectivity / fragmentation • Disturbances Status and conservation value assessment Threat assessment • Conservation Context • Land ownership • Land management • Key connecting patches (nodes) Vulnerability and opportunity
MISS housing density (from SILVIS data) Three Basic Spatial Scales of Analysis • Adjacent to park – 3 km buffer. • Data-limited; Networks/parks can enhance results • Local – 30 km buffer • Regional scale – variable • Based on watersheds and biomes
Three Basic Time Scales of Analysis • Historical • How did we get here, and how fast? • Current • What is status of resource / driver / attribute? • Future • Where are we headed, should we do something about this, and if so, what?
Main products – for _all_ I&M Parks • Results and evaluation • Methods • Data sets • Stand-alone graphics Pipestone Population Density
These projects rely on Landsat, especially NLCD • For the future: • Continuity!!! • Change products • Integrative land cover change program • MODIS -> Landsat -> Ikonos • Tighter link to climate change issues • Phenology • Land cover change • C accounting models • Tools to locate / process Landsat image stacks
For more information: http://science.nature.nps.gov/im/monitor
Specific objectives • Describe and evaluate informative landscape-scale variables • historical, current, and projections where available. • Produce Standard Operating Procedures that are easily used by Networks • Provide consistent & comparable measures across the NPS system. • Provide underlying data to parks and Networks. • Recommend ways to build on & enhance results.
Reports for all I&M parks: • narrative justifying & describing measures • evaluation of individual measures • overall assessment • datasets • maps, graphs, tables, and text to communicate results (pdf, jpg) Socioeconomic reports are ‘best practice’
Project Phases • Scoping and project initiation - Aug 2008 to Jan 2009 • Develop project infrastructure • ID measures • Acquire & process data • Draft Measurement Development summaries • 2.Development – Nov 2008 to July 2009 • Template report • Work flows developed and implemented • 3.Production and analysis – May 2009 – • Full-on production of results, reports, & graphics
What we have now Data sets • Climate • Precipitation • Temperature (min/max, variability) • Growing season days • NDVI • Growing season • Hydrology • Hydrologic Units 4, 6, 8, and 12-digit • NHD Medium and high resolution (where available) • Dams • Aquifers • Ground water climate response network • Sea ice (North America) • Landform • DEM - 10, 30, and 120 meter • Slope, Aspect • Depth to bedrock • Sand, silt, clay fractions • Crop capability • Geology • Boundaries • Omernick Ecoregions • Bailey Ecoregions • Physiographic Provinces • States • Counties • NPS Units (with various buffers) • Federal Lands • National Wilderness Preservation System • NPS Vital Sign Networks • Continental Divide • Protected Areas Boundaries • NCDC Climate Divisions • NEON Domains • Land Cover • Enhanced NLCD 1992 • NLCD 1992 • NLCD 2001 • NLCD Change Product • NLCD Impervious Surface • NLCD Tree Canopy • Historic Natural Fire Regime • Landfire - all products • Land cover diversity (Simpson's) • Land cover characteristics • Forest fragmentation • Forest cover types • Converted vs. Natural Landcover • Population • Nightime Lights (1992/93, 2000) • Populated Places • U.S. Cities • U.S. Urban Areas • 1990, 2000 Census Block Groups • SEDAC Census Grids • Housing Density (1940-2040) • Inventoried roadless area • Agriculture census by county • Water use by county • Conservation risk index • Wildland Urban Interface • Transportation • Roads - Multiple data sources • Railroads (U.S. and Canada)
Measurement Development Summaries in Progress Land cover land use Conservation status Population Housing Roads Night lights Phenology • Analytical Products (multiple spatial scales) • Housing Density: • units / sq km, by partial Census block group • Population Density: • individuals / sq mile, by Census block group • Road Density: • km / sq km