Download

1 / 33
330 likes | 484 Views
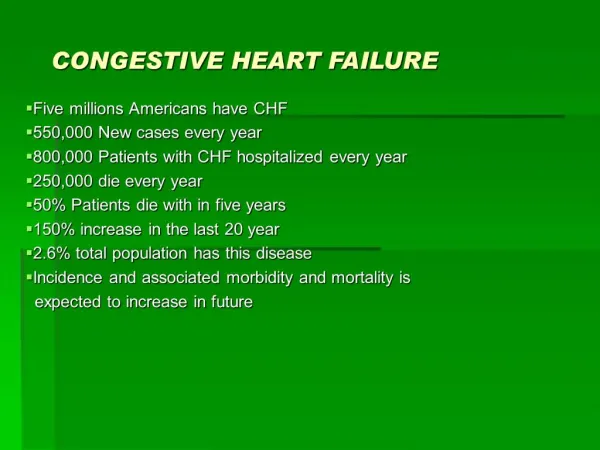
Predicting Risk of Re-hospitalization for Congestive Heart Failure Patients (in collaboration with ) Jayshree Agarwal Senjuti Basu Roy, Ankur Teredesai, Si-Chi Chin, David Hazel, Kiyana , Mehrdad , (UWT)

E N D
Predicting Risk of Re-hospitalization for Congestive Heart Failure Patients (in collaboration with ) Jayshree Agarwal SenjutiBasu Roy, Ankur Teredesai, Si-Chi Chin, David Hazel, Kiyana, Mehrdad, (UWT) Paul Amoroso, Yoshi Williams, Dr. Lester Reed, Sheila, Eric Johnson (MHS)
MHS- UWT Web and Data Science collaboration objectives • Predict the RISK of Readmission for CHF patients • Reduce the Readmission rate and cost • Improve patient satisfaction and quality of care • Appropriate pre-discharge and post-discharge planning • Proper resource utilization
Problem • Develop models that can predict risk of readmission for CHF patients within • 30 days after discharge • 60 days after discharge • The readmission may happen for other reasons in addition to CHF
Overall Approach • How to solve the problem? • Apply predictive data mining techniques such as, classification • What do these predictive mining techniques require? • Data in homogeneous format • Information Extraction, Integration, and data preparation • Prepare labeled dataset to train the model; used later on for testing.
Our Challenges • Building domain knowledge • Which variables to consider? • How to merge and unify them in a homogeneous format (information extraction and integration) • How to understand the relative importance of the variables in the prediction task? • How to prepare data? • Class label generation • Noisy real world data (missing values, inconsistencies, etc.) • Serious skew in the dataset
Building Predictive Classification Models • Data Understanding • Data Preprocessing • Modeling • Evaluation
Data Understanding • Collect initial data • Acquire Domain knowledge • Describe and explore dataset • Create data visualization
Building Predictive Classification Models • Data Understanding • Data Preprocessing • Modeling • Evaluation
Data Preprocessing • Finding Eligible CHF admissions • Define class label • Attribute selection • Data Integration • Removal of incomplete data
Eligible CHF admissions and Generating Class Labels All CHF Admissions In hospital deaths removed Eligible CHF Admissions X=30 X=60 Is there any readmission within x days of discharge? YES The class label is assigned as 1 The class label is assigned as 0 NO
Attribute selection • Yale Model [Krumholzet al] • -Socio-Demographic variable(2) • -Comorbidities(35) Chi-square correlation test “Baseline” • “All” • “Correlated” • Additional predictor variables identified by us (14) “New”
Data Extraction Labeled data Patient details Table Joins Incomplete data removed Data used for training the Models Primary and Secondary diagnosis Data Lab measurement Administrative data
Data Distribution • 30 days time frame • 60 days time frame
Building Predictive Classification Models • Data Understanding • Data Preprocessing • Modeling • Evaluation
Modeling • Logistic regression • Naïve Bayes classifier • Support Vector Machine Selecting modeling technique for Binary Classification Balancing imbalanced data by under-sampling and over sampling Building prediction models
Logistic Regression Model P (Probability of Y) Z ------>
Naïve Bayesian Classification • Statistical Classifier performs probabilistic prediction based on Bayes Theorem • Assumes that the attributes are conditionally independent • Given a data tuple X and m classes • Predicts X belongs to only if is highest among all the for all the m classes
Support Vector Machine • A method of classification for both linear and non linear data • Searches for optimal separating hyperplane separating the two classes
Building Predictive Classification Models • Data Understanding • Data Preprocessing • Modeling • Evaluation
Performance Evaluation Metrics • Precision – percentage of tuples labeled as positive are actually positive = TP/TP+FP • Recall – measures the percentage of positive tuples that are labeled positive = TP/TP+FN • Accuracy – percentage of tuples correctly classified = (TP+TN)/P+N • ROC curves and area under the curve (AUC) – Shows the trade-off between true positive rate and false positive rate.
Evaluation • Predictive models are assessed using 10 fold cross validation • The performance is compared using different evaluation metrics mentioned previously
Logistic Regression for 30 days Area Under the Curve (AUC) Recall
Logistic regression for 60 days Area Under the Curve (AUC) Recall
Naïve Bayes classifier for 30 days Area Under the Curve (AUC)
Support Vector Machine for 30 days Area Under the Curve (AUC)
Conclusion and Discussion • It is one of the difficult problem to solve • Feature selection gives the best results. • With data balancing recall of the model improves
Future Work • Investigate other classifier techniques like ensemble methods, neural networks • To explore additional features and study their relevance • To employ other feature selection techniques • To device a method to impute missing values • Deploying the predictive models
Acknowledgement • Multicare health System (MHS) and Dr. Lester Reed for giving us this opportunity • Data architects and domain experts in MHS for their inputs • Professors Dr. AnkurTeredesai and Dr. SenjutiBasu Roy for their guidance • Other team members in UWT for their support
References • S. F. Jencks, M. V. Williams, and E. A. Coleman, “Rehospitalizations among Patients in the Medicare Fee-for-Service Program,” New England Journal of Medicine, vol. 360, no. 14, pp. 1418–1428, 2009. • J. Han and M. Kamber, Data mining: concepts and techniques. Morgan Kaufmann, 2006 • H. M. Krumholz, S. L. T. Normand, P. S. Keenan, Z. Q. Lin, E. E. Drye, K. R. Bhat, Y. F. Wang, J. S. Ross, J. D. Schuur, and B. D. Stauffer, Hospital 30-day heart failure readmission measure methodology. Report prepared for the Centers for Medicare & Medicaid Services.