Download
1 / 41
410 likes | 570 Views
Findings from the 2011 CIRP Freshman Survey. Higher Education Research Institute at UCLA. CIRP Freshman Survey. Project of the Higher Education Research Institute at UCLA Comprehensive survey of incoming first-time full-time college students

E N D
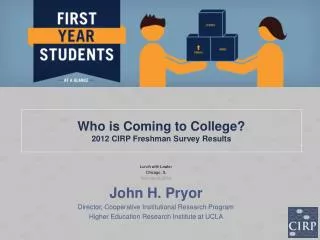
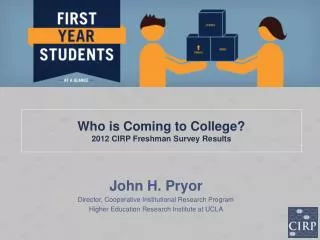
Findings from the 2011 CIRP Freshman Survey Higher Education Research Institute at UCLA
CIRP Freshman Survey Project of the Higher Education Research Institute at UCLA Comprehensive survey of incoming first-time full-time college students Beginning of longitudinal research program that continues with the YFCY, DLE, and CSS 46th year and over 15 million students total
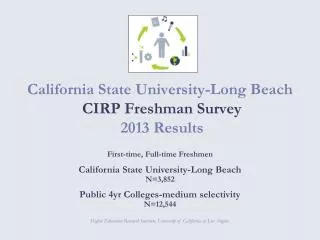
CIRP Freshman Survey 2011 • Administered at • 396 colleges and universities • 267,984 students • “Norms” (high response rates) • 270 colleges and universities • 203,967 students • Weighted to the 1.5 million entering students in four-year institutions
CIRP Conceptual Framework • Student experience is comprehensive, multifaceted and inter-related, not focused on one or two issues • Look at cognitive and affective domains • Collect data that is: • Behavioral (what students do, i.e., study, interact, etc) • Psychological (attitudes, values, self-concept) • Environmental (campus climate, residence type)
Astin’s I-E-O Model ENVIRONMENT YFCY/DLE/CSS (e.g., residence, interactions with peers and faculty, curricular and co-curricular experiences) INPUT CIRP Freshman Survey (previous academic performance, financial concerns, expectations, degree aspirations, self-concept in high school, race, sex) OUTCOME YFCY/DLE/CSS (gains in college, satisfaction with college, retention, post-college plans)
Political and Social Views Academically-Oriented Students Reasons for Going to College How Students Pay for College College Choice Social Networking Revisiting 2010 CIRP Freshman Survey Findings 2011 Freshman Survey Findings
Political and Social Views Academically-Oriented Students Reasons for Going to College How Students Pay for College College Choice Social Networking Revisiting 2010 CIRP Freshman Survey Findings 2011 Freshman Survey Findings
Support for Political/Social Issues(% Indicating “Agree Strongly” or “Agree Somewhat”)
Increasing Support for Same-Sex Marriage (% Indicating “Agree Strongly” or “Agree Somewhat”)
Support for Same-Sex Marriage, by Political Orientation(% Indicating “Agree Strongly” or “Agree Somewhat”)
Undocumented Immigrants Should be Denied Access to Public Education(% Indicating “Agree Strongly” or “Agree Somewhat”)
Trends in Support for Legalization of Marijuana(% Indicating “Agree Strongly” or “Agree Somewhat”)
Support for Legalization of Abortion(% Indicating “Agree Strongly” or “Agree Somewhat”)
A National Health Care Plan is Needed to Cover Everybody’s Medical Costs(% Indicating “Agree Strongly” or “Agree Somewhat”)
Summary • Movement on issues in a liberal direction • Self-identification as liberal or conservative moving down • Middle-of-the-road moving up • Conservative students moving on some issues, liberals on others
Political and Social Views Academically-Oriented Students Reasons for Going to College How Students Pay for College College Choice Social Networking Revisiting 2010 CIRP Freshman Survey Findings 2011 Freshman Survey Findings
Expectations for College: Discussing Course Content with Students Outside of Class(% Indicating “Very Good Chance”)
Looking at Graduation Rates Using Results from the CIRP Freshman Survey • Students who studied more as seniors in high school had a higher probability of graduating college in 4, 5, or 6 years • Students who were more likely to come to class late in high school were less likely to graduate from college in 4, 5, or 6 years Completing College: Assessing Graduation Rates at Four-Year Institutions
Political and Social Views Academically-Oriented Students Reasons for Going to College How Students Pay for College College Choice Social Networking Revisiting 2010 CIRP Freshman Survey Findings 2011 Freshman Survey Findings
Trends in Reasons for Going to College(% Indicating “Very Important”)
Reasons for Going to College, by Probable Major(% Indicating “Very Important”)
Reasons for Going to College, by Probable Major(% Indicating “Very Important”)
Political and Social Views Academically-Oriented Students Reasons for Going to College How Students Pay for College College Choice Social Networking Revisiting 2010 CIRP Freshman Survey Findings 2011 Freshman Survey Findings
Sources of Financing for First Year of College(% Indicates Any Funds Received)
Receiving More than $10,000 or More in Scholarships or Grants to Cover Expenses in the First Year of College
Expect to Use $10,000 or More in Loans to Cover Expenses in the First Year of College
Changes in Financing College • Fewer funds available from scholarships • Fewer students anticipate contributing funds from their own savings or jobs • Average indebtedness for college graduates in 2010: $25,250 • Increased 5% from 2009 (The Institute for College Access & Success, 2011)
Student Concerns About Financing College • 11.9% have major concerns • Similar to 2010 (11.1%) • 22.1% of students at HBCUs have major concerns • 55.5% have some concerns • Similar to 2010 (54.5%)
Political and Social Views Academically-Oriented Students Reasons for Going to College How Students Pay for College College Choice Social Networking Revisiting 2010 CIRP Freshman Survey Findings 2011 Freshman Survey Findings
Trends in College Acceptance and Attendance at First-Choice Institution
College Acceptance and Attendance at First-Choice Institution, by Generation Status and Sex
Political and Social Views Academically-Oriented Students Reasons for Going to College How Students Pay for College College Choice Social Networking Revisiting 2010 CIRP Freshman Survey Findings 2011 Freshman Survey Findings
Time Spent on Social Networking as High School Seniors, by Sex(% Spending 3 or More Hours Per Week)
Political and Social Views Academically-Oriented Students Reasons for Going to College How Students Pay for College College Choice Social Networking Revisiting 2010 CIRP Freshman Survey Findings 2011 Freshman Survey Findings
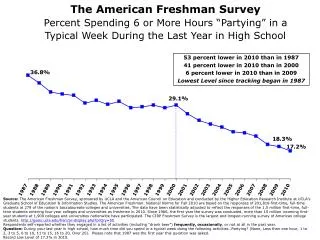
Following Up From 2010 • Emotional Health (“highest 10%” or “above average”) • 51.9% in 2010 → 52.6% in 2011 • “Overwhelmed by all I had to do” (“frequently”) • 29.1% in 2010 → 28.5% in 2011 • Parental Unemployment • Fathers: 4.9% in 2010 → 4.7% in 2011 • Mothers: 8.6% in 2010 → 8.6% in 2011
For More Information www.heri.ucla.edu heri@ucla.edu