Download
1 / 95
960 likes | 1.18k Views
CS 277, Data Mining Cluster Analysis. Padhraic Smyth Department of Computer Science Bren School of Information and Computer Sciences University of California, Irvine. Announcements. Assignment 1 Questions? Due Wednesday, hardcopy in class, code to EEE Be sure to document your code

E N D
CS 277, Data MiningCluster Analysis Padhraic Smyth Department of Computer Science Bren School of Information and Computer Sciences University of California, Irvine
Announcements • Assignment 1 • Questions? • Due Wednesday, hardcopy in class, code to EEE • Be sure to document your code • Be sure to clearly explain graphs/plots in your report • Office Hours • Grader (Maryam): Mondays, 4 to 5 • Professor: Tuesdays, 10 to 11:30 • Projects • Will discuss on Wednesday • EEE Message Board • Now open for discussion – intended for inter-student communication
Outline of Today’s Lecture • Clustering Algorithms • K-means algorithm • Distance measures and multidimensional geometry • Hierarchical clustering algorithms • Probabilistic model-based clustering • Graph-based/spectral clustering
Notation • N objects, each with d measurements/variables/attributes • data vector for ithobject, • Data matrix • is the ith row, jth column • columns correspond to variables • rows correspond to objects or data vectors • For real-valued data we can think of our points as being in a d-dimensional space, e.g., clusters as “clouds of points”
Hypercube in d dimensions Hypersphere in d dimensions High-Dimensional Data (From David Scott, Multivariate Density Estimation, Wiley, 1992)
Hypercube in d dimensions Hypersphere in d dimensions Dimension 2 3 4 5 6 7 Relative Volume 0.79 ? ? ? ? ? High-Dimensional Data (From David Scott, Multivariate Density Estimation, Wiley, 1992) What is the volume of the sphere relative to the cube in d dimensions?
Hypercube in d dimensions Hypersphere in d dimensions Dimension 2 3 4 5 6 7 Relative Volume 0.79 0.53 0.31 0.16 0.08 0.04 High-Dimensional Data (From David Scott, Multivariate Density Estimation, Wiley, 1992) What is the volume of the sphere relative to the cube in d dimensions?
n objects each with d real-valued measurements • Most common distance metric is Euclidean distance: Euclidean Distance • Makes sense in the case where the different measurements are commensurate; each variable on roughly on the same scale • Recommended to prestandardize the data (divide each variable by its range or variance) before using – otherwise some variables may dominate
Jaccard coefficient (e.g., for sparse vectors, 1’s much rarer than 0’s) Distances between Binary Vectors • matching coefficient Number of variables where item j =1 and item i = 0
Other Types of Distances • Categorical variables • d(x, y) = number of matching values divided by number of dimensions • Distances between strings of different lengths • e.g., “Joe Brown” and “Joseph F. Brown” • Can use edit distance or semantic distance ,e.g., d(“Joe” and “Joseph”) is small • Distances between images and waveforms • Shift-invariant, scale invariant e.g., d(x,y) = min_{a,b} { (ax+b) – y } • This is in effect another form of edit distance • See also dynamic time-warping
Clustering • “Automated detection of group structure in data” • Typically: partition N data points into K groups (clusters) such that the points in each group are more similar to each other than to points in other groups • descriptive technique (contrast with predictive) • for real-valued vectors, clusters can be thought of as clouds of points in d-dimensional space • Important points to keep in mind • There is often “no best clustering” for a data set • Can think of clustering as a potentially useful way to group data points • Different clustering algorithms provide different groupings
Why is Clustering Useful? • “Discovery” of new knowledge from data • Contrast with supervised classification (where labels are known) • Long history in the sciences of categories, taxonomies, etc • Can be very useful for summarizing large data sets • For large n and/or high dimensionality • Applications of clustering • Clustering results produced by a search engine • Segmentation of patients in a medical study • Discovery of new types of galaxies in astronomical data • Clustering of genes with similar expression profiles • …. many more
Other Issues in Clustering • Distance function, d(x,y) is often a critical aspect of clustering, both • distance of individual pairs of objects • distance of individual objects from clusters • How is K, number of clusters, selected? • Different types of data • Real-valued versus categorical • Input data: N vectors or an N2 distance matrix?
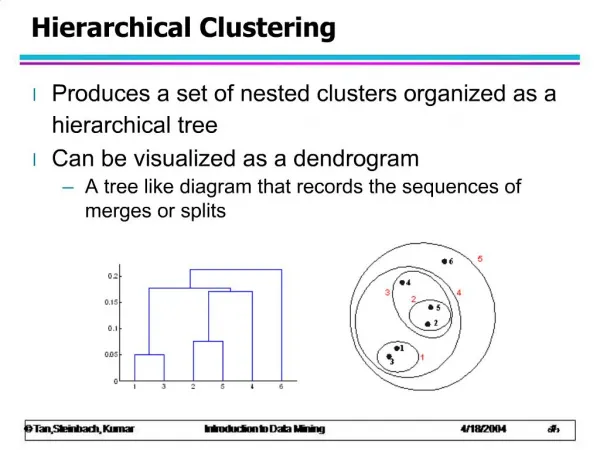
Different Types of Clustering Algorithms • partition-based clustering • Represent points as vectors and partition points into clusters based on distance in d-dimensional space • probabilistic model-based clustering • e.g. mixture models [both work with measurement data, e.g., feature vectors] • hierarchical clustering • Builds a tree (dendrogram) starting from an N x N distance matrix between objects • graph-based/spectral clustering (not discussed) • represent inter-point distances via a graph and apply graph algorithms
Different Types of Input to Clustering Algorithms • Data matrix N rows d columns • Distance matrix N x N distances between objects
The K-Means Clustering Algorithm • Input: • N real-valued vectors x1, …. xN of dimension d • K = number of clusters required (K > 1) • Output: • K cluster centers, c1, …. cK, each center is a vector of dimension d • A list of cluster assignments (values 1 to K) for each of the N input vectors
Squared Errors and Cluster Centers • Squared error (distance) between a data point x and a cluster center c: d [ x , c ] = Sj ( xj - cj)2 Sum is over the d components/dimensions of the vectors
Squared Errors and Cluster Centers • Squared error (distance) between a data point x and a cluster center c: d [ x , c ] = Sj ( xj - cj)2 • Total squared error between a cluster center c(k) and all Nk points assigned to that cluster: Sk = Si d [ xi, ck ] Sum is over the d components/dimensions of the vectors Distance is usually defined to be Euclidean distance Sum is over the Nk points assigned to cluster k
Squared Errors and Cluster Centers • Squared error (distance) between a data point x and a cluster center c: d [ x , c ] = Sj ( xj - cj)2 • Total squared error between a cluster center c(k) and all Nk points assigned to that cluster: Sk = Si d [ xi, ck ] • Total squared error summed across K clusters SSE = SkSk Sum is over the d components/dimensions of the vectors Distance is usually defined to be Euclidean distance Sum is over the Nk points assigned to cluster k Sum is over the K clusters
K-means Objective Function • K-means: minimize the total squared error, i.e., find the K clusters centers m(k), and assignments, that minimize SSE= SkSk = Sk( Si d [ xi , ck ] ) • K-means seeks to minimize SSE, i.e., find the cluster centers such that the sum-squared-error is smallest • will place cluster centers strategically to “cover” data • similar to data compression (in fact used in data compression algorithms)
K-Means Algorithm • Random initialization • Select the initial K centers randomly from N input vectors randomly • Or, assign each of the N vectors randomly to one of the K clusters • Iterate: • Assignment Step: • Assign each of the N input vectors to their closest mean • Update the Mean-Vectors (K of them) • Compute updated centers: the average value of the vectors assigned to k Newck = 1/NkSixi • Convergence: • Did any points get reassigned? • Yes: terminate • No: return to Iterate step Sum is over the Nk points assigned to cluster k
Example MSE Cluster 1 = 1.31 MSE Cluster 2 = 3.21 Overall MSE = 2.57
Example MSE Cluster 1 = 1.31 MSE Cluster 2 = 3.21 Overall MSE = 2.57 MSE Cluster 1 = 1.01 MSE Cluster 2 = 1.76 Overall MSE = 1.38
Example MSE Cluster 1 = 0.84 MSE Cluster 2 = 1.28 Overall MSE = 1.05
Example MSE Cluster 1 = 0.84 MSE Cluster 2 = 1.28 Overall MSE = 1.04
K-means • Ask user how many clusters they’d like. (e.g. K=5) • (Example is courtesy of Andrew Moore, CMU)
K-means • Ask user how many clusters they’d like. (e.g. K=5) • Randomly guess K cluster Center locations
K-means • Ask user how many clusters they’d like. (e.g. K=5) • Randomly guess K cluster Center locations • Each datapoint finds out which Center it’s closest to.
K-means • Ask user how many clusters they’d like. (e.g. K=5) • Randomly guess k cluster Center locations • Each datapoint finds out which Center it’s closest to. • Each Center finds the centroid of the points it owns
K-means • Ask user how many clusters they’d like. (e.g. K=5) • Randomly guess k cluster Center locations • Each datapoint finds out which Center it’s closest to. • Each Center finds the centroid of the points it owns • New Centers => new boundaries • Repeat until no change
K-Means Clustering Applied to Time-Series Data (Gene Expression over Time) 1108 genes From Kulterer et al., BMC Genomics 2007
Clustering RGB Vectors for Image Compression Original Image Image after clustering 8-bit RGB vectors into 11 clusters Figures from David Forsyth, UC Berkeley
Properties of the K-Means Algorithm • Time complexity?? O( N K d ) in time per iteration e = cost of distance computation, e.g., e = d for Euclidean distance in d dimensions This is good: linear time in each input parameter • Convergence to Global Minimum? Does K-means always converge to the best possible solution? i.e., the set of K centers that minimize the SSE? No: always converges to *some* solution, but not necessarily the best • Depends on the starting point chosen To think about: prove that SSE always decreases after every iteration of the K-means algorithm, until convergence. (hint: need to prove that assignment step and computation of cluster centers both decrease the SSE)
Local Search and Local Minima Non-convex optimization problem SSE Cluster centers
Local Search and Local Minima Non-convex optimization problem SSE Cluster centers Global Minimum
Local Search and Local Minima SSE Local Minima
Local Search and Local Minima SSE SSE
Suboptimal Results from K-means on Simulated Data Why does k-means not perform so well on this example? Figure from http://en.wikipedia.org/wiki/K-means_clustering
Issues with K-means clustering • Simple, but useful • tends to select compact “isotropic” cluster shapes • can be useful for initializing more complex methods • many algorithmic variations on the basic theme • e.g., in signal processing/data compression is similar to vector-quantization • Choice of distance measure • Euclidean distance • Weighted Euclidean distance • Many others possible • Selection of K • “scree diagram” - plot SSE versus K, look for “knee” of curve • Limitation: may not be any clear K value
Probabilistic Clustering • Hypothesize that the data are being generated by a mixture of K multivariate probability density functions (e.g., Gaussians) • Each density function is a cluster • Data vectors have a probability of belonging to a cluster rather than 0-1 membership • Clustering algorithm • Learn the parameters (mean, covariance for Gaussians) of the K densities • Learn the probability memberships for each input vector • Can be solved with the Expectation-Maximization algorithm • Can be thought of as a probabilistic version of K-means
Expectation-Maximization (EM) for Gaussian Clustering • E-Step • Given K means and K covariance shapes of K Gaussian clusters…. ..compute probability that each of N data points to belong to each of K Gaussian clusters • M-Step • Given probability that each of N data points to belong to each of K Gaussian clusters….…compute K new means and K new covariance shapes for the K Gaussian clusters • Initialize randomly (the means/covariances or the memberships) • One iteration is an E step and an M step • Continue to iterate until the K means/covariances and/or the memberships are not changing (or hardly changing) • Increases the P(data | clusters) at each step, converges to (local) optimum
Data from Professor C. McLaren Department of Epidemiology, UCI