Download
1 / 23
240 likes | 355 Views
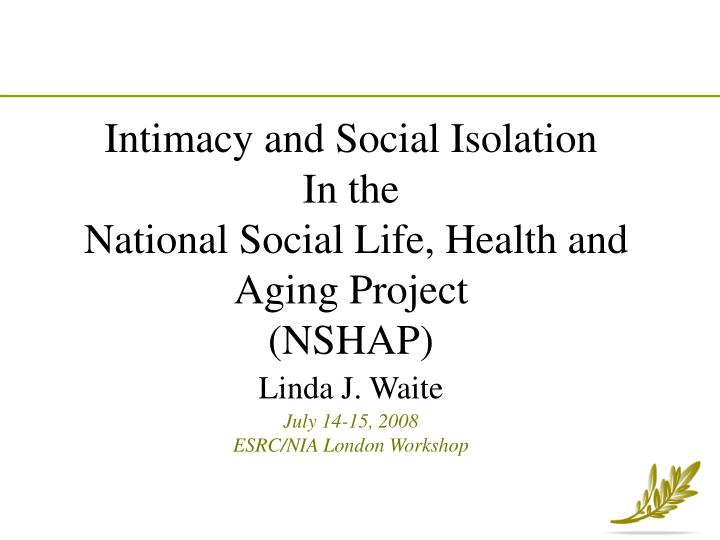
Intimacy and Social Isolation In the National Social Life, Health and Aging Project (NSHAP) Linda J. Waite July 14-15, 2008 ESRC/NIA London Workshop. Variety of indicators of isolation Different types of isolation affect particular aspects of health Possible mechanisms?.

E N D
Intimacy and Social Isolation In the National Social Life, Health and Aging Project (NSHAP) Linda J. Waite July 14-15, 2008 ESRC/NIA London Workshop
Variety of indicators of isolation Different types of isolation affect particular aspects of health Possible mechanisms? Intimacy Protects & Social Isolation Kills… but How and Why?
Interview 3,005 community-residing adults ages 57-85 Population-based sample with minority over-sampling 120-minute in-home interview Questionnaire Biomeasure collection Leave-behind questionnaire National Social Life, Health, and Aging Project
Mental Health Measures Anxiety HADS (7 items) modified to match those of the Center for Epidemiological Studies Depression Scale Bereavement Four items Depression CES-D (11 items) Happiness Single item Loneliness Three-item scale Self esteem Single item Stress Four item modification of Cohen’s Perceived Stress Scale
Biomeasures Anthropometrics Height, weight, BMI Waist circumference Medications Blood pressure Get up and go Biological or biologically-derived indicators of disease
Blood Spots • C-reactive protein • Epstein-Barr Virus Antibody Titers • Hemoglobin A1c
Indicators of Social Isolation Forms of Social Isolation • Objective Social Isolation • Living alone • Social network size and characteristics • Social inactivity • Perceived lack of social support • Emotionally distant relationships • Loneliness • Physical separation from others • Subjective Social Isolation • Perception that relationships with others are low quality, emotionally distant, or unsatisfying
Objective Social Isolation Scale (α = .74) • Social network characteristics • Size • Range • Contact volume • Proportion of network members in the household • Social involvement • Participation in organized groups • Religious attendance • Volunteering • Number of Friends
Subjective Social Isolation Scale (α = .71) • Emotional closeness with network members • Perceived social support • Spouse or current partner • Family members • Friends • Feelings of loneliness and not belonging • Loneliness Scale (Hughes, Waite, Hawkley, and Cacioppo 2004) • Lack companionship • Feel left out • Feel isolated • “I was lonely”
Figure 2. Predicted Probability of Very Good or Excellent Physical Health, by Levels of Objective and Subjective Isolation
Figure 3. Predicted Probability of Very Good or Excellent Mental Health, by Levels of Objective and Subjective Isolation
Social Isolation and Self-Rated Health • Objective and subjective isolation are distinct forms of social isolation • Both objective and subjective isolation are independently related to self-rated physical health • The effect of objective isolation on mental health may operate through the very strong link between subjective isolation and mental health
How Do Intimacy & Isolation Affect Health? • Through damage done by stress
Stress Increased + frequent rapid changes in blood pressure Increase in turbulent flow + shear stress on artery walls Endothelial injury Atherosclerosis and narrowed vessels Hypertension Sympathetic Nervous System ActivationandAtherosclerosis and Hypertension
Regressions Predicting Systolic Blood Pressure by Gender Net of: Age, education, race/ethnicity, presence of spouse/partner, antihypertensive drugs, depression, anxiety, stress, and sleep quality.
Regressions Predicting CRP by Gender Net of: Age, education, race/ethnicity, presence of spouse/partner,SBP, antihypertensive drugs, depression, anxiety, and stress. † significant at 10%; * significant at 5%; ** significant at 1%
National Social Life, Health, and Aging Project • NSHAP data publicly available • NACDA at ICPSR University of Michigan
Figure 1. The Relationship between Objective Isolation and Subjective Isolation
Table 1. Ordered Logistic Regressions Predicting Self-Rated Physical Health (n = 2978)
Table 2. Ordered Logistic Regressions Predicting Self-Rated Mental Health (n = 2980)
Figure 4. Predicted Depressive Symptoms, by Levels of Objective and Subjective Isolation