Download
1 / 1
10 likes | 78 Views
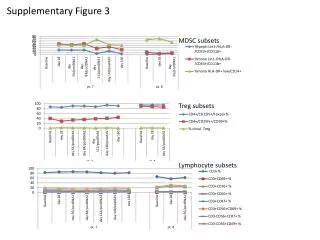
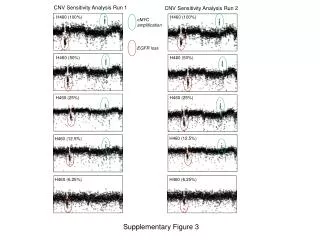
Supplementary figure 3 Gene expression profiling for ERMS, ARMS and human control myoblasts.

E N D
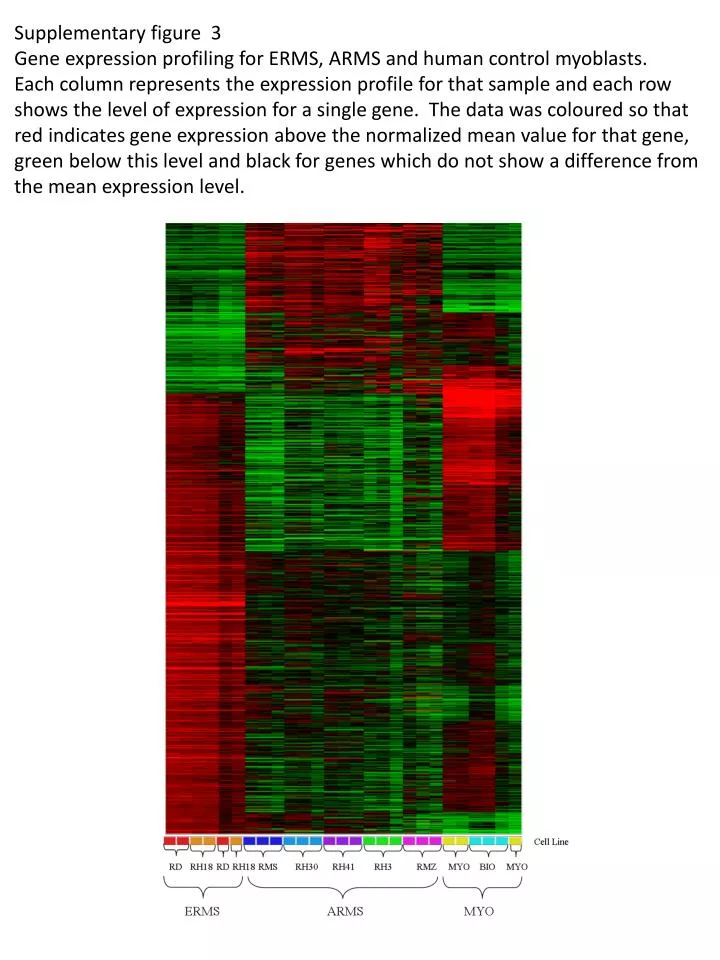
Supplementary figure 3 Gene expression profiling for ERMS, ARMS and human control myoblasts. Each column represents the expression profile for that sample and each row shows the level of expression for a single gene. The data was coloured so that red indicates gene expression above the normalized mean value for that gene, green below this level and black for genes which do not show a difference from the mean expression level.