Download
1 / 19
190 likes | 385 Views
Geometrical model of the Baltic artesian basin. Juris Sennikovs , Janis Virbulis , and Uldis Bethers Laboratory for Mathematical Modelling of Environmental and Technological Processes UNIVERSITY OF LATVIA. Contents of presentation. Description of Baltic artesian basin

E N D
Geometrical model of the Baltic artesian basin JurisSennikovs, Janis Virbulis, and UldisBethers Laboratory for Mathematical Modelling of Environmental and Technological Processes UNIVERSITY OF LATVIA
Contents of presentation • Description of Baltic artesian basin • Algorithms of geometrical structure model • Highlights of geometrical structure • Examples of groundwater flow model results • Summary Motivation There exist several local modelling studies of ground water flow for the parts of the Baltic artesian basin (BAB) The aim of the present work is the development of a closedhydrogeological mathematical model of the whole BAB This presentation focuses on the development of the geometrical model of the BAB
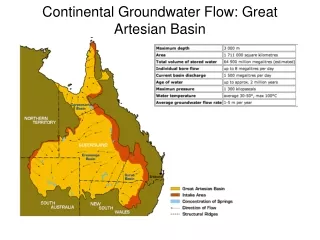
Area of study Baltic artesian basin (BAB) is a multi-layered and complex hydrogeological systemup to 5000 m deep BAB fully covers the territory of Latvia, Lithuania and Estonia, parts of Poland, Russia, Belarus as well as large area of the Baltic Sea, including island of Gotland. It is the main drinking water source in the Baltic countries Crystalline bedding reaches surface Depth ~5000 m Depth <500 m Area - 484000 km2 Volume - 579000 km3 Average thickness- 1.2 km
Scheme of integrated model system development Information base Geometry model Hydrogeological model • 3D mesh • equations • numerical method • boundary conditions • calibration • solutions Geological data Monitoring data Closed 3D spatial model, which includes geological structure and properties of geological materials • input • update • storage • access • remote access(web) • Objects(layers, faults, materials) • Automatic mesh generation • Stratigraphy (hronological generation) • Result: groundwater flow in BAB
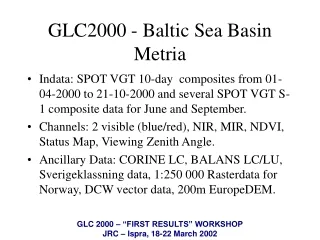
Data sources Stratigraphic information from boreholes in Latvia and Estonia Maps of height isolines of geological layers for Latvia and Lithuania Maps of sub-quaternary deposits in Latvia and Lithuania Maps of fault lines on the crystalline basement surface in Latvia, Lithuania and Estonia Buried valley data from Latvia and Estonia Earth topography data Baltic sea depth data Data from published geological cross-sections, information from books and other sources. Unification of the heterogeneous information from different sources with uneven data coverage, are performed. Algorithms are developed for this purpose considering the priority, importance and plausibility of each of each data sources in integrating topography and lithology dataas well as borehole data
Model construction algoritms Database of boreholes Filtering (MySQL) Subquaternary rock data Parameters Borderline Isolines Fault lines Set of points Set of thicknesses Line “Law” 3D surface 2D triangular mesh Table 2D triangulation 3D surface Outer border Layer thickness Set of 3D surfaces Geological stratification Volume mesh DATA/Result External sources (models) Algorithm 3D volume mesh
Geometry generation – automated scripting The construction of the geometric mesh is implemented by specially developed script in Python. Scripting has several advantages: flexibility in choosing ways to build the structure; parallelization in developing/updating of different structure elements; documented and repeatable structure building path; possibility to rebuild the structure with slight or significant modifications at any time; possibility to build, and maintain several structures of different complexity simultaneously; extension to the next stages of the model development – calculation of groundwater flows and mass transport and model [auto]calibration.
Mesh • Finite element (FE) method was employed for the calculation of the 3-dimensional groundwaterflows with free surface. • 3D mesh was constructedlayer-wise. • The triangular mesh in horizontal plane was constructed including characteristic lines such as rivers,borders of countries and areas of presence of geological layers. • Fault lines are also taken into account consideringthe displacements along the fault • Most of the 3D finite elements are triangular prisms. Pyramids and tetrahedraare used near the fault lines and wedge lines of geological layers. Typical lines Model border Border of the geological material Rivers Edges of triangular mesh coincide with the line data
Finite element (FE) method was employed for the calculation of the 3-dimensional groundwaterflows with free surface. • 3D mesh was constructedlayer-wise. • The triangular mesh in horizontal plane was constructed including characteristic lines such as rivers,borders of countries and areas of presence of geological layers. • Fault lines are also taken into account consideringthe variable displacements along the fault • Most of the 3D finite elements are triangular prisms. Pyramids and tetrahedraare used near the fault lines and wedge lines of geological layers. Mesh Finite element mesh, view from the top. Higher resolution of mesh in areas with sufficient geological data
Example of model construction sequence – basement Faults Isolines - Latvia Isolines - Lithuania Boreholes - Latvia
Example of model construction sequence – basement Boreholes - Estonia Isolines – Baltic sea Final level data at points Additional data Russia, Belorus
Example of model construction sequence – basement Interpolation to 2D mesh Interpolation of faults
Geological structure Geological structure consists of 42 layers distinguished on the basis of each geological unit hydraulic properties and geological data resolution. The number of layers are allowed to vary across the domain. It includes aquifers and aquitards from Vendian up to the Quaternary deposits. Quaternary sequence is treated as four layer structure with variable number of layers across the domain. Fault displacements are incorporated into the model taking into account data from the published structural maps. Four reconstructed regional erosion surfaces (upper Ordovician, Devonian, Permian and Quaternary) are included into the model. Quaternary Paleogenic/Neogenic Cretaceous Jurassic Triassic Permian Carboniferous 42 layers Devonian Silurian Ordovician Cambrian Vendian
Geological structure Regional erosion surface Quaternary sequence Level, m Tectonic faults Wedging out of layers Distance, km Vertical exaggeration 200:1 Vertical section from soutwest to northeast along line A-B
Vertical cross section from south to north South, Vilnius North, Kohtla-Järve Rīga Quaternary Devonian Ordovician/Silurian Level, m Cambrian/Vendian Distance, km Vertical exaggeration 300:1
Distribution of piezometric head in south-north vertical crossection North, Kohtla-Järve South, Vilnius Rīga Upper layers Lower Devonian aquifers Regional aquiclude D2nr O-S, aquicludes Cm-V aquifers
Distribution of head in D3gj layer, schematic flow directions Main discharge areas Main recharge areas
Summary Data for the bulding of regional model of Baltic artesian basin has been collected and prepared Geometry model of the Baltic artesian basin geological structure is developed, consisting of 42 layers 3D finite element mesh for the groundwater flow and mass transport calculations are prepared. Automated script for the generation of the geological structure and 3D finite element mesh was prepared allowing for the paralel, repeatable and documented building of the model. The present work has been funded by the European Social Fund project „Establishment of interdisciplinaryscientist group and modelling system for groundwater research” (Project Nr.2009/0212/1DP/1.1.1.2.0/09/APIA/VIAA/060)
Thank You for attention! The present work has been funded by the European Social Fund project „Establishment of interdisciplinaryscientist group and modelling system for groundwater research” (Project Nr.2009/0212/1DP/1.1.1.2.0/09/APIA/VIAA/060)