Download
1 / 20
210 likes | 239 Views
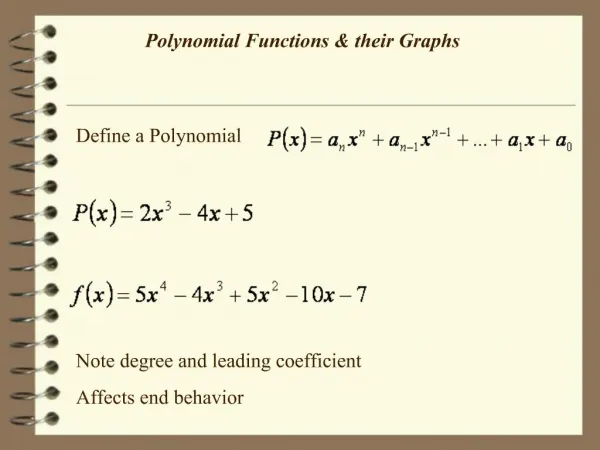
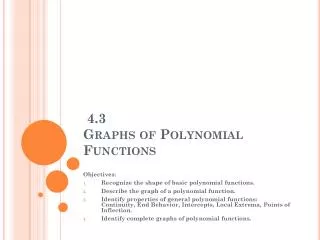
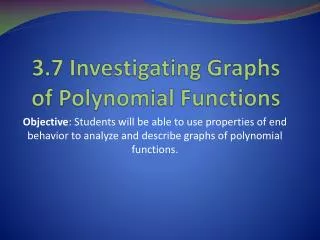
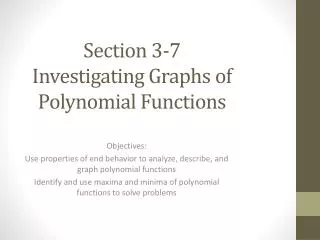
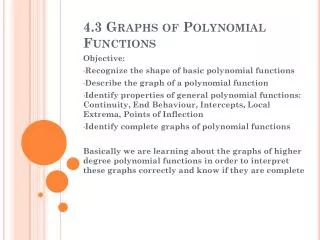
Understand the behavior of graphs of polynomial functions, the number of turns, and end behavior based on degree and leading coefficient. Learn how to graph and interpret polynomial functions effectively.

E N D
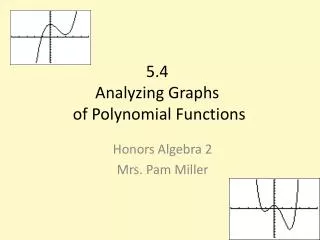
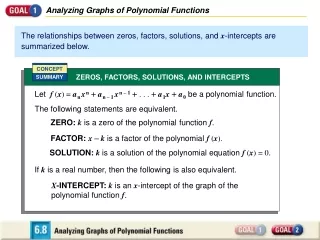
Investigating Graphs of Polynomial Functions Section 6-7 6-7 - Investigating Graphs of Polynomial Functions
Graphs of Polynomial Functions Graphs of Polynomial functions: • Are Continuous – No Breaks • Have smooth turns • With degrees of n, have at most n-1 turns. • In other words, if the polynomial has a degree of 3, there will be 2 turns. • If the polynomial has a degree of 4, there will be 3 turns, etc… 6-7 - Investigating Graphs of Polynomial Functions
Turns • If the first coefficient is POSITIVE, it will RISE to the right (positive x side). • If the first coefficient is NEGATIVE, it will FALL to the right. • If the top degree is an EVEN number, the graph will RISE to the left (negative x side). • If the top degree is an ODD number, the graph will FALL to the left. • Exception to the rule, if the degree has a negative coefficient, its OPPOSITE. >> FOLLOW THE ARROWS << 6-7 - Investigating Graphs of Polynomial Functions
Polynomials How many turns are there? Linear: 0 turns Quadratic: 1 turn 6-7 - Investigating Graphs of Polynomial Functions
Polynomials 2 turns 3 turns 4 turns 6-7 - Investigating Graphs of Polynomial Functions
Determining End Behavior • Degree • Sign of Leading Coefficient • Touchdown- • Offsides- • Disco 1- • Disco 2-
End behavior is a description of the values of the function as x approaches infinity (x +∞) or negative infinity (x –∞). The degree and leading coefficient of a polynomial function determine its end behavior. It is helpful when you are graphing a polynomial function to know about the end behavior of the function. End Behavior As x goes to negative infinity, P(x) goes to negative infinity 6-7 - Investigating Graphs of Polynomial Functions
Example 1 How many turns? How would you describe the graph from negative x? 2 6-7 - Investigating Graphs of Polynomial Functions
Example 2 How many turns? How would you describe the graph from positive x? 2 6-7 - Investigating Graphs of Polynomial Functions
Example 3 How many turns? How would you describe the graph from negative x to positive x? 4 6-7 - Investigating Graphs of Polynomial Functions
Example 4 How many turns? How would you describe the graph from negative x to positive x? 3 6-7 - Investigating Graphs of Polynomial Functions
Example 5 Identify the end behavior of P(x) = 2x5+ 3x2 – 4x –1 As x –∞, P(x)–∞. As x +∞, P(x) +∞. 6-7 - Investigating Graphs of Polynomial Functions
Example 6 Identify the end behavior of P(x) = 2x5+ 6x4 – x + 4 As x –∞, P(x)–∞. As x +∞, P(x) +∞. 6-7 - Investigating Graphs of Polynomial Functions
Example 7 Identify the end behavior of P(x) = 2x5+ 6x4 – x + 4 As x –∞, P(x)–∞. As x +∞, P(x) –∞. 6-7 - Investigating Graphs of Polynomial Functions
Graphing Polynomials • Plug the equation into the graphing calculator, Y= • Look at the table to plot points • Sketch the graph • Describe the end behaviors As x –∞, P(x)–∞. As x +∞, P(x) –∞. 6-7 - Investigating Graphs of Polynomial Functions
Example 8 Graph the function. f(x) = x3 + 4x2 + x – 6. As x –∞, P(x)–∞. As x +∞, P(x) +∞. 6-7 - Investigating Graphs of Polynomial Functions
Assignment Page 457 15-22,32-35,36-41 my.hrw.com mstarkey42 panthermath 6-7 - Investigating Graphs of Polynomial Functions