Download
1 / 15
150 likes | 362 Views
Comfort and Climate. WEATHERIZATION ENERGY AUDITOR SINGLE FAMILY. WEATHERIZATION ASSISTANCE PROGRAM STANDARDIZED CURRICULUM – December 2012. Learning Objectives. COMFORT AND CLIMATE. By attending this session, participants will be able to: List the basic principles of human thermal comfort.

E N D
Comfort and Climate WEATHERIZATION ENERGY AUDITOR SINGLE FAMILY WEATHERIZATION ASSISTANCE PROGRAM STANDARDIZED CURRICULUM – December 2012
Learning Objectives COMFORT AND CLIMATE By attending this session, participants will be able to: • List the basic principles of human thermal comfort. • Describe relative humidity. • Demonstrate how to use a psychrometric chart.
Comfort Defined COMFORT AND CLIMATE Most humans share a general range of comfort. 68F – 85F 15% to 75% relative humidity (RH) • Air movement speeds heat transfer • Mean radiant temperature • Activity level Conditioning matters! People grow accustomed to heat, cold, and humidity.
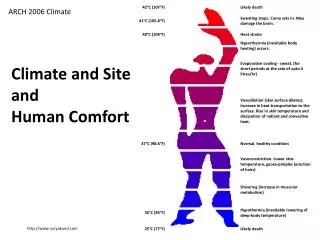
Factors in Thermal Comfort COMFORT AND CLIMATE Environmental: • Air temperature • Relative humidity (RH) • Air motion • Mean radiant temperature Personal: • Clothing insulation value • Metabolic rate This chart shows the interaction of two of the environmental factors in thermal comfort.
Visualizing Thermal Comfort COMFORT AND CLIMATE Image courtesy of
Air Temperature COMFORT AND CLIMATE While humans are generally comfortable between 68F and 82F, relative humidity affects the comfort range. Photos courtesy of Bill Van der Meer
Relative Humidity COMFORT AND CLIMATE Relative Humidity (RH) The amount of water vapor contained in a given volume of air relative to the total amount of water vapor it is capable of containing, expressed as a percentage. • 100% RH = Condensation • Humans are comfortable at 15% - 75% RH, depending on activity level. • Tolerance to upper limit drops as activity level rises. • Below 15% RH, medical issues arise. Photos courtesy of Bill Van der Meer
Measuring Relative Humidity COMFORT AND CLIMATE • Sling Psychrometers • Two thermometers side-by-side • One is wrapped in wet wick (wet bulb), the other is dry (dry bulb) • Spinning it around speeds temperature stabilization • Plot wet bulb and dry bulb temperature on psychrometric chart to determine dew point and RH. Photos courtesy of Bacharach Sling Psychrometer
Psychrometric Chart #1 COMFORT AND CLIMATE Dry bulb = 80° Wet bulb = 66° Dew point = 60° RH = 50% Grains of water per pound of dry air Table created for the US DOE WAP National Standardized Curricula
Psychrometric Chart #2 COMFORT AND CLIMATE 156 78 Grains of water per pound of dry air Table created for the US DOE WAP National Standardized Curricula
Psychrometric Chart #3 COMFORT AND CLIMATE Grains of water per pound of dry air Table created for the US DOE WAP National Standardized Curricula
Psychrometric Chart #4 COMFORT AND CLIMATE Grains of water per pound of dry air Table created for the US DOE WAP National Standardized Curricula
Psychrometric Chart #5 COMFORT AND CLIMATE Grains of water per pound of dry air Table created for the US DOE WAP National Standardized Curricula
RH Things to Remember COMFORT AND CLIMATE • Warm, wet air contacting cold surfaces creates condensation instantly. • Cold winter air typically contains very little moisture. When that air is heated, the RH drops even further. • RH below 15% can lead to respiratory problems, failure of furniture glue and other problems.
Summary COMFORT AND CLIMATE • Air temperature, movement and relative humidity effect thermal comfort. • Ideal conditions: • Heating season: 68F, 20% to 40% RH. • Cooling season: 75F, keep RH below 60%. • Control drafts. • Minimize temperature swings. • Be aware of mean radiant heat transfer. • Plot wet and dry bulb temperatures on a psychrometric chart to determine dew point and relative humidity.