Download

1 / 8
80 likes | 180 Views
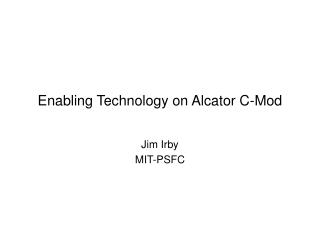
Turbulence associated with the control of internal transport barriers in Alcator C-Mod plasmas.

E N D
Turbulence associated with the control of internal transport barriers in Alcator C-Mod plasmas Nils P. Basse, E.M.Edlund, D.R.Ernst, C.L.Fiore, J.H.Irby, G.J.Kramer1, L.Lin, Y. Lin, A.G.Lynn2, E.S.Marmar, D.R.Mikkelsen1, P.E.Phillips2, M.Porkolab, J.E.Rice, S.M.Wolfe, S.J.Wukitch, K.Zhurovich MIT Plasma Science and Fusion Center 1Princeton Plasma Physics Laboratory 2University of Texas at Austin Motivation: Nonlinear GS2 simulations suggest that trapped electron modes (TEMs) are more unstable during on- than off-axis ICRF heating of ITB plasmas. TEMs limit the density gradient. [D.R.Ernst et al., 20th IAEA Fusion Energy Conference, 2004] Method: Measure turbulence before and during on-axis heating. Result: Qualitative agreement between GS2 simulations and turbulence measurements. 46th APS-DPP conference, November 15-19, 2004 Savannah, Georgia, USA US DoE Grant No. DE-FC02-99ER54512
Fluctuation diagnostics • Phase-contrast imaging (PCI): • Measures line integrated electron density fluctuations along 32 vertical chords. • Sensitive to turbulence from 0.5 to 8 cm-1. • Reflectometry: • Measures localized electron density fluctuations. • 132 GHz channel has cutoff at 2.21020 m-3.
ITB discharge waveforms Shot: 1040323033 Toroidal field: 4.5 T Plasma current: 0.8 MA
Density profiles Thomson scattering profiles fitted to measurements. Blue line/squares: H-mode at 0.761 seconds, off-axis ICRF heating only. Black line/diamonds: ITB at 1.027 seconds, off-axis heating only. Red line/triangles: ITB at 1.227 seconds, off- and on-axis heating.
PCI and reflectometry spectra • Increase of low frequency turbulence and stronger edge quasi-coherent (QC) mode seen by PCI in response to on-axis ICRF heating. • Small overall decrease of fluctuations visible in reflectometry (localized above the pedestal).
PCI wavenumber spectra Wavenumber spectra vs time integrated over [20,80] kHz.
PCI and simulated spectra Red triangles: PCI wavenumber spectrum during off- and on-axis ICRF heating. Red line: TEM turbulence from nonlinear GS2 simulation. Black diamonds: PCI wavenumber spectrum during off-axis heating only. Black line: TEM turbulence from nonlinear GS2 simulation.
Conclusions • ITBs are created using off-axis ICRF heating. • Additional on-axis heating controls the density gradient. • Increased transport during on-axis heating due to trapped electron mode (TEM) turbulence is found in nonlinear GS2 simulations. Ion temperature gradient driven modes do not change. • GS2 simulations agree with TRANSP effective thermal and particle diffusivities in the ITB. • Low frequency ([20, 80] kHz) fluctuations at medium wavenumbers (2-3 cm-1) measured by PCI grow stronger as on-axis heating is added. • Initial quantitative comparisons between GS2 and PCI wavenumber spectra are promising. • http://www.psfc.mit.edu/people/basse/