Download
1 / 15

E N D
Broadband Satellite-Like (Infrared) Cloud Products from NCEP Models and Preliminary Cloud VerificationB. Ferrier1,2, H.-Y. Chuang1,2, E. Rogers1, B. Zhou1,2, J. McQueen1, and G. DiMego11NOAA/NWS/NCEP/EMC2SAIC/GSOThanks also to P. Manousos (NWS/NCEP/HPC),K. Campana1, M. Hart1,2, and J. Hanna (NESDIS)
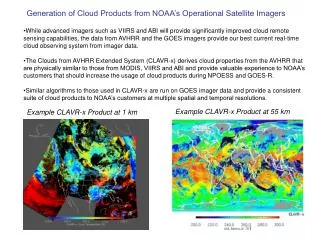
Background on Satellite Cloud Products • Project motivation • Interest in forecast satellite look-a-like clouds by Hydrologic Prediction Center (HPC) and NWS Eastern Region • Such products already produced by CMC & U. Wisconsin • 2 simple infrared (IR) algorithms in WRF Nonhydrostatic Mesoscale Model (WRF NMM – to replace Eta on June 13) • Brightness temperature (Tb) from TOA outgoing longwave fluxes (= e*s*Tb4, e=1, s=5.67·10-8 W m-2 K-1 ; Stefan-Boltzman Law) • WRF NMM, NAM use GFDL LW radiation (’85, ’91), modified by Global Branch (Hou et al.) • NCAR algorithm (Stoelinga) – starting from TOA find air temperature at cloud optical depth of t = 1 (using cloud emissivities in model)
Forecasts (left) & obs (right) @ 00Z 30 May 2006 0015 UTC • 24-hWRF NMM forecasts • TOA total IR (top, left): colder Tb’s (atmos abs/emis) • NCAR algorithm (bot, left): warmer Tb’s
Forecasts (left) & obs (right) @ 00Z 30 May 2006 0015 UTC • 12-hWRF NMM forecasts • TOA total IR (top, left): colder Tb’s (atmos abs/emis) • NCAR algorithm (bot, left): warmer Tb’s
Forecasts (left) & obs (right) @ 12Z 29 May 2006 1215 UTC • 24-hWRF NMM forecasts • TOA total IR (top, left): colder Tb’s (atmos abs/emis) • NCAR algorithm (bot, left): warmer Tb’s
Forecasts (left) & obs (right) @ 12Z 29 May 2006 1215 UTC • 12-hWRF NMM forecasts • TOA total IR (top, left): colder Tb’s (atmos abs/emis) • NCAR algorithm (bot, left): warmer Tb’s
Final Remarks on Cloud Products • TOA IR and NCAR IR cloud-top will be available in 32-km grid 221 files (next slide) • Can be viewed from our parallel WRF NMM runs (“NAMX”, “NAMY”) from the past week athttp://wwwt.emc.ncep.noaa.gov/mmb/mmbpll/nampll12_fullcyc_2mbtop/ Jump link “TOA Brightness Temperatures” (left frame) • More improvements needed before use in operations at HPC and WFOs • More accurate narrowband calculations • Use CRTM in our unified (regional, global) post processing for multiple frequencies (e.g. water vapor) • JCSDA funding would accelerate pace of effort
Preliminary Cloud Verification • Objective verification using NCEP’s Forecast Verification System (FVS) • Typical verification uses values of model grid points at observation points (“grid-to-obs” verification) • Expanded to verify model grids using analysis grids (“grid-to-grid” verification) • AFWA total cloud cover product • Clouds from AVHRR (CLAVR) total cloud cover • Validation over 12-km grid 218 (next slide) • Focus mostly on operational NAM (Eta), but also show preliminary results from WRF NMM
Verification 12-km Grid 218 vs. full NAM domain (Eta-12)
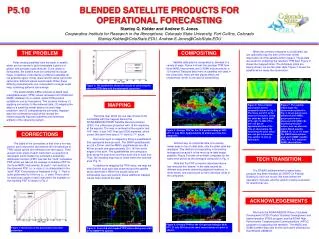
12 12 18 18 00 00 06 06 12 12 18 18 00 00 06 06 12 12 18 18 00 00 06 06 12 12 18 18 00 00 Time (UTC) Time (UTC) AFWA RMSE (%) Bias (%) CLAVR 0 6 0 6 12 18 24 30 36 42 48 54 60 66 72 78 84 12 18 24 30 36 42 48 54 60 66 72 78 84 Forecast Hour Forecast Hour 12Z NAM (Ops Eta) vs. AFWA, CLAVR 1200 UTC 23 March – 1200 UTC 15 May 2006 • Smallest NAM biases at midday (18Z), largest in early morning • Closer agreement (smaller errors) with CLAVR
Missing WRF NMM Runs NAM - AFWA WRF NMM - AFWA NAM - CLAVR WRF NMM - CLAVR Bias (%) RMSE (%) March March April April May May Time Series of 48-h NAM and WRF NMM Cloud Forecasts 1200 UTC 23 March – 1200 UTC 15 May 2006 • Both models agree more closely with CLAVR • Both models have a high bias in total cloudiness • WRF NMM has a higher cloud bias than NAM (low clouds?)
OBS HIT NAM - AFWA NAM - CLAVR WRF NMM - AFWA FCST WRF NMM - CLAVR Model Biases as Functions of Cloud Fraction 23 March - 15 May 2006 Forecast-Hit-Observation (FHO) stats (48-h forecasts valid at 12Z) Area Bias (Model / Analysis) • Almost 50% high bias in overcast conditions • Dominated by low clouds (esp over oceans; not shown) Threshold Cloud Fraction (%)
Final Remarks on Cloud Verification • Models tend to predict too much cloudiness compared to AFWA, CLAVR analyses • Better agreement during midday, worse agreement during early morning hours • Models compare more favorably to CLAVR • Slightly higher bias in WRF NMM cloudiness compared to NAM-Eta (esp. for AFWA at 12Z, less so for CLAVR) • Largest over prediction in overcast conditions • JCSDA funding would also accelerate pace and scope of development to include more models and “verifying” analyses (next slide as an example)
Ops Eta • Useful for quick sanity checks of forecast incoming surface solar • Thanks to Istvan Laszlo (NESDIS) for providing 18Z images online, and to K. Mitchell, D. Tarpley WRF NMM 18-h FCST vs. GOES Retrieved (SW↓)sfc