Download
1 / 14
140 likes | 145 Views
AGENDA. Homework 3 Parameter Estimates Equations Coefficient of Determination (R 2 ) Formula Overall Model Test (F Test for Regression). I. Homework 3.

E N D
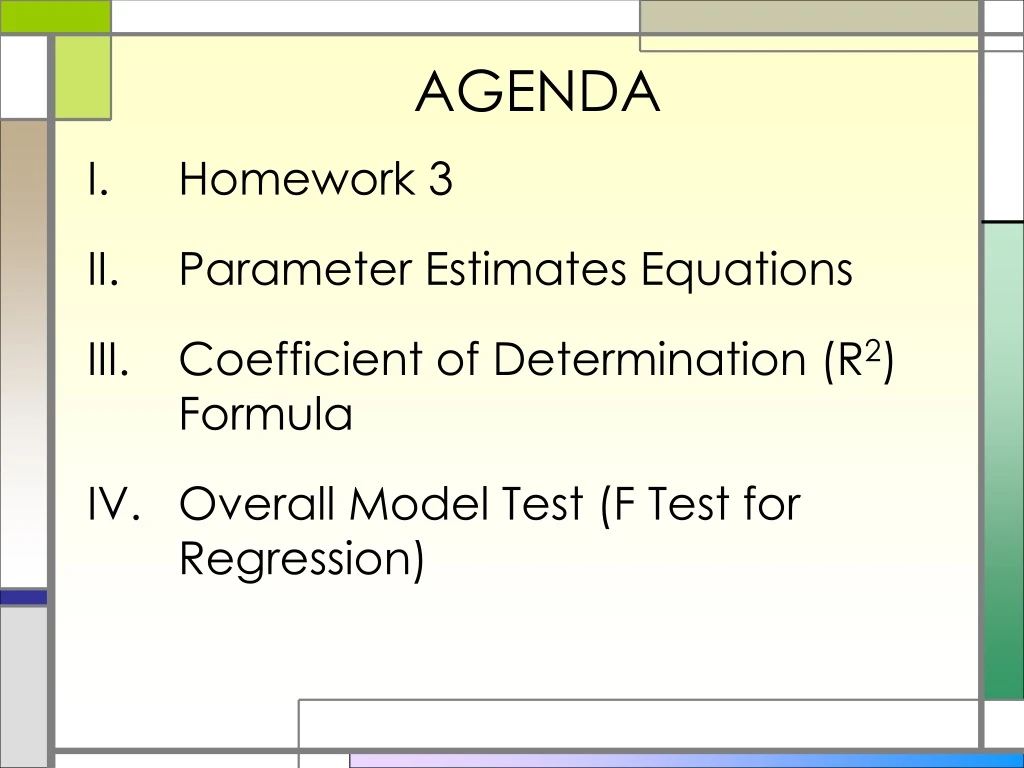
AGENDA • Homework 3 • Parameter Estimates Equations • Coefficient of Determination (R2) Formula • Overall Model Test (F Test for Regression)
I. Homework 3 1) 10-22 (Note that the solutions to 10.11 and 10.21 are in the back of the book and contain the information needed to solve the problem) 2) 10.34 3) 10.38 (Note that the solutions to 10.11 and 10.21 are in the back of the book and contain the information needed to solve the problem) 4) 10.44 Due Friday, March 19.
What is Regression? Statistical technique for developing a mathematical equation that explains the relationship between a dependent variable (y) and one or more independent variables (x). Types of regression in MKT 317: • Simple Linear Regression: Only one X • Multiple Regression: More than one X
Simple Linear Regression Model Population Regression Model: Y = dependent variable X = independent variable β0 = intercept of the straight line on the Y axis β1 = slope of the straight line ε = random error term Sample Regression Model: Y = predicted value of Y b0 = sample estimate of β0 b1 = sample estimate of β1
Regression Scenario One generally held belief in the business world is that taller men earn more money than shorter men. In a University of Pittsburgh study, 30 MBA graduates, all approximately the same age were polled and asked to report their annual incomes and heights.
II. Parameter Estimates Example Given: SSxy= 2451.925 = 69.6 SSx= 257.2 = 108.23 SSy= 30156.32 Find the sample regression line
II. Parameter Estimates Example 2 Given: Find the sample regression line = 228,437.91 = 30 = 69.6 = 145,582 = 108.23
III. Coefficient of Determination (R2) Formula R2 = or The amount of variance explained by the model
III. Coefficient of Determination (R2) Example From the regression output, tell the proportion of variation in salary that is explained by height. Given SSR = 23,374.56 SSE = 6,781.76 SST = 30,156.32
H0: β1 = 0, no linear relationship between the variables H1: β1 ≠ 0, linear relationship between the variables Fcalc = F critical dfnumerator = k dfdenominator = n-k-1 n = sample size k = number of independent variables IV. Overall Model Test (F Test for Regression)
IV. Overall Model F Test ANOVA Table for Regression
III. Overall Model Test Example (cont.) Given SSR and SST, conduct an overall model test