Download
1 / 2
20 likes | 197 Views
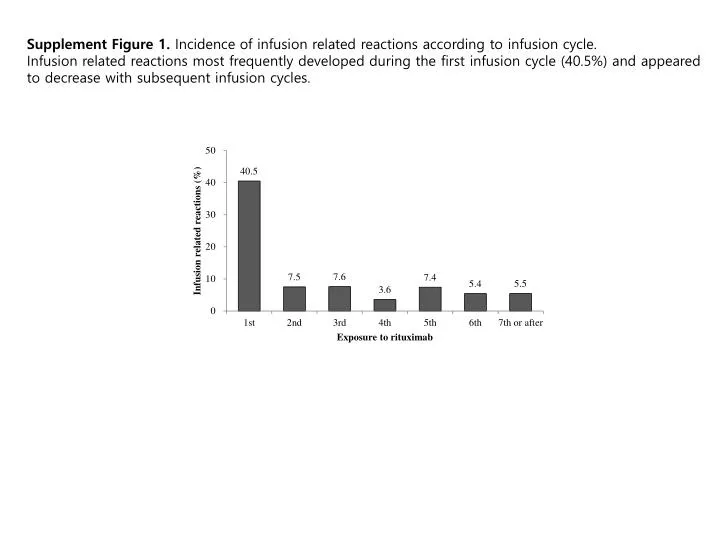
Supplement Figure 1. Incidence of infusion related reactions according to infusion cycle. Infusion related reactions most frequently developed during the first infusion cycle (40.5%) and appeared to decrease with subsequent infusion cycles.

E N D
Supplement Figure 1. Incidence of infusion related reactions according to infusion cycle. Infusion related reactions most frequently developed during the first infusion cycle (40.5%) and appeared to decrease with subsequent infusion cycles.
Supplement Figure 2. Difference in NCI grade of infusion related reactions according to infusion cycle. There was gradual decrement in the percentage of grade 2 or higher infusion related reactions according to increment of infusion cycle (P<0.001). n=16 n=40 n=37 n=230