Download
1 / 84
840 likes | 1.05k Views
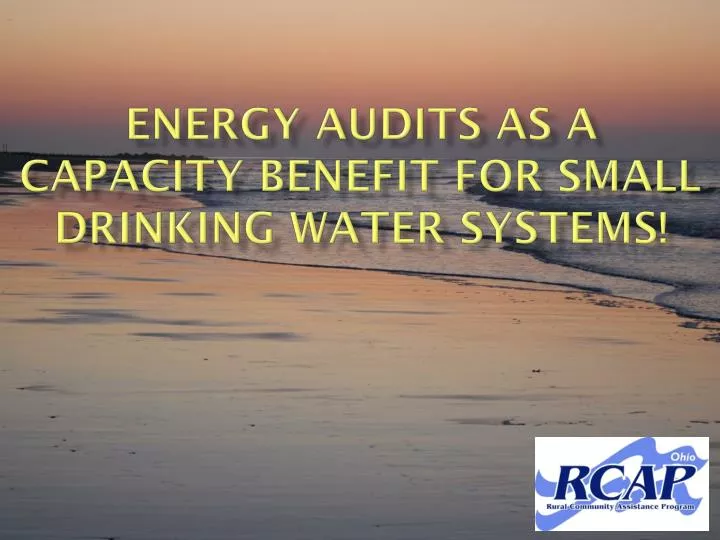
Energy Audits as a Capacity Benefit for Small Drinking Water Systems!. Greetings!. Topic: Energy Audits for Small Water Utilities Presenter: Scott A. Strahley, PE, CEA Association: Ohio RCAP (Rural Community Assistance Program) Event: ASDWA Training, January 12, 2012.

E N D
Energy Audits as a Capacity Benefit for Small Drinking Water Systems!
Greetings! • Topic: • Energy Audits for Small Water Utilities • Presenter: • Scott A. Strahley, PE, CEA • Association: • Ohio RCAP (Rural Community Assistance Program) • Event: • ASDWA Training, January 12, 2012
Goals of the Presentation: • Originally designed for Community and Auditor training and implementation • Beneficial Overview for States • Understanding usefulness • Promote Implemetation • What are the Current Energy Audit Results? • Avg: >28% Reduction& <1 year Payback
Who We Are? • RCAP Founded in 1972 • National Non-Profit Organization • Focus on Communities with < 10,000 pop. • 6 Regions • RCAC (Western US) • Midwest Assistance Program (MAP, North-Central US) • Community Resource Group (CRG, South-Central US) • Great Lakes RCAP (Northern US) • Southeast RCAP (South-Eastern US) • RCAP Solutions (North-Eastern US)
The RCAP Network Western RCAPRural CommunityAssistance Corporation916-447-2854www.rcac.org Midwest RCAPMidwest Assistance Program952-758-4334www.map-inc.org Southern RCAPCommunity Resource Group479-443-2700www.crg.org Northeast RCAPRCAP Solutions800-488-1969www.rcapsolutions.org Great Lakes RCAPWSOS Community Action Commission800-775-9767www.glrcap.org Southeast RCAPSoutheast Rural Community Assistance Project866-928-3731www.southeastrcap.org Rural Community Assistance Partnership800-321-7227www.rcap.org
Who We Are? • Great Lakes RCAP • 7 States: Illinois, Indiana, Kentucky, Michigan, Ohio, West Virginia, Wisconsin • The Target: provide technical assistance to help small communities address their drinking water, wastewater and community development needs • The Regional RCAP is administered by the WSOS Community Action Commission, Inc. in Fremont, Ohio • GLRCAP = 45 TAPs/State Coordinators/Staff • Ohio RCAP = 22 Full-Time Employees
What We Do In Ohio! • Write Grant/Loan Applications for Project Funding • Perform Utility Rate Studies • Preparation of Capacity Assurance Plans • Assist in Asset Management Planning • Provide Community Planning and Visioning • Administer Community Training • Utility Management (Technical, Managerial, Financial) • Financial Management • Asset Management • Project Development • Decentralized Wastewater • Energy Audits (ASHRAE Level I and II)
What is Energy Efficiency? • Energy Efficiency – • It is doing the same tasks using less energy, through technology and practice • Not compromising quality, safety, or comfort Lighting: All of Them! 24 x 7 x 365!!!!
Benefits of Energy Efficiency • Reduction of Energy Costs (Saves Money)! • Reduction of Energy Use • Environmental Stewardship • Reduce Greenhouse Gas Emissions • At Facility • From Power Generation • Water Conservation • Facility Sustainability
Benefits of Energy Efficiency • Improve Equipment Operating Efficiency • Enhance Equipment Life • Reduction of Equipment Maintenance • Provide Affordable Utility Service • Billing Rates for Residents and Customers • Strengthen Your System Capacity! • Time…Costs are Rising! • Compounding Effect
Energy Efficiency Goals • How Can You Achieve Energy Efficiency? • An Energy Audit is the Best Start!
Definition: • Audit: • (1) a formal examination of an organization’s or individual’s accounts or financial situation, • (2) a methodical examination and review -Merriam-Webster Dictionary • In Terms of Energy: • An analysis of the energy usage for a facility or operation and the identification of possible energy conservation opportunities • ASHRAE Levels I, II, and III • Others…
What That Means: • An Energy Audit will identify the energy-using equipment in a facility and quantify why, how, and how much energy is being used • It will involve billing statements and analysis of the equipment and processes • 24-36 months of data is preferred for trending
Benefits of an Audit • Benchmarking • Identifying Trends • Decision Tool for Change • Equipment, Processes, System • Budget Planning • Knowledge of the System • Water Loss • Error Reduction • Billing, Payments, Meters, Chemicals
Benefits of an Audit • Use as Guidance, Not Gospel! • Inexact Science, At Best! • Assumptions • Rate Fluctuations • Rates, Riders, Mid-year Changes • Sliding Scale Based On Usage • Operational Changes • Equipment Performance • Personnel Performance • Emergencies
But, Why is it Important? Address the issues, or bury your head in the sand!
But, Why is it Important? • Estimates Are Indicating That: • Nearly 4% of the nation’s electricity is consumed with respect to water and wastewater facilities • Within the next 15 years, the cost of energy will increase approximately 20% • An increase in utility budgeting will most likely result in increased customer billing charges
But, Why is it Important? • EnergyStar Estimates: • $4 Billion in Annual Energy Costs • Drinking and Waste Water Treatment Combined • 56 Billion kWh for Drinking and Waste Water • 44.8 Million Tons of Greenhouse Gas
But, Why is it Important? • Estimates Are Indicating That: • Funding programs have more applications and less available money • Commonly, facilities have been designed for peak capacity, not to operate efficiently • Most likely the demographics of your community has changed (up or down)
But, Why is it Important? • Estimates Are Indicating That: • A large percentage of municipal energy use is associated with water and wastewater treatment • Approximately 30-60%of a municipal budget • “If drinking water and wastewater systems reduce energy use by just 10%...collectively they could save approximately $400 million and 5 billion kWh annually” • US EPA – Ensuring a Sustainable Future: An Energy Management Guidebook for Wastewater and Water Utilities
But, Why is it Important? • Specific to Ohio: • Ohio Ranks 6th in National Energy Consumption • Public Water Systems scored a D+ Grade (US – D-) • Est. 9.68 Billion needed for Infrastructure (POTW) • ARRA Funding est. at 58.5 Million (0.6%) • Public Wastewater Systems scored a D+ Grade • Est. 11.16 Billion needed for Infrastructure (POTW) • Est. 850 Billion Gallons of CSO/yr • Est. 10 Billion Gallons of SSO/yr -ASCE 2009 Ohio Infrastructure Report Card
How are Energy Audits Performed? Understanding of the processes, the equipment, and the regulations is vital to a worthwhile energy audit for water systems…
How an Energy Audit Starts: • Understand Your Billing • Structure (Classification, Tariff, etc.) • Quantities (kW, kWh, kVAR, Power Factor, etc.) • Accuracy (Estimated, Monthly, Yearly Averages) • Understand Your Facility • Processes • Flows • Equipment • Goals
How Billing Works: • Your rate structure or classification is your ‘contract’ with the energy provider to reserve ‘capacity’ for your use • If you reserve more, and use less, there is a penalty! • If you reserve less, and use more, there is a penalty! • Demand is measured in kW (kilo-watt) • A 15-minute peak measurement, applied to the whole billing cycle • Energy is measured in kWh (kilo-watt hours) • A cumulative amount over time
Example: • A 60-watt light bulb is turned ‘on’ • 10-hours per day • 5-days per week • The Demand is: • 60 watts / 1,000 = 0.06 kW • The Energy Use is: • 0.06 kW x 10-hrs = 0.6 kWh/day • 0.6 kWh/day x 5-days = 3 kWh/week • 3 kWh/week x 52-weeks = 156 kWh/yr
How Billing Works: • The bill is typically broken down into: • An Energy Generation Fee • An Energy Transmission Fee • An Energy Distribution Fee • A Customer Charge • All Applicable Riders (‘Special’ Charges) • The Facility Energy Usage Cost • The Facility Demand Charge (if Applicable) • Taxes (if Applicable)
How Billing Works: • Don’t Worry About All the Fees!!! • Focus On: • The Facility Energy Usage Cost (Total) • The Facility Demand Charge (if Applicable)
The Billing Statement: • A Billing Statement Should Include: • Rate Structure, (Tariff or Other) • Energy Use, (kWh for Electricity) • Demand Loading, (kW Demand) • Total Cost, (Generation, Transmission, Distribution, Customer Charge, Riders, Taxes – Combined!) • Service Period (Bills Typically Lag) • Meter Reading Accuracy (Actual vs. Estimated) • Meter Location (Usage Location) • Power Factor (and Power Factor Constant) • Adjustment Notes (Rate Changes, etc.)
Typical Energy Use Graph: Treatment Baseline Heating Months Graph Baseline is Facility Energy Use, Above Baseline is Winter Heating Use (Gas Usage)
Typical Energy Use Graph: Graph is Facility Gas Usage Converted Units to kWh for Comparison
Typical Energy Use Graph: Graph is Exterior Lighting With Optical Sensor
Typical ‘Generic’ Audit: • Energy Usage Summary • Replace Motors with Energy Efficient • Replace Lighting with Energy Efficient • Summary of Estimated Savings • Beneficial…but NOT THOROUGH!!!
The RCAP ‘5-Step’ Process: • 1. The Initial Assessment • Benchmarking • 2. The Initial Audit • Energy Use Analysis • 3. The Physical Audit • On-Site Walk-Thru • 4. The Facility Analysis • Combining the Data • 5. The Findings Report
1. The Initial Assessment • With ‘Broad’ Facility Data (Facility Survey), Determine Cursory Benchmarks: • Service Population • MG/Yr • Cost ($)/kWh • kWh/MG • Cost ($)/MG • Compare to similar facilities • Compare to similar regions
The RCAP Difference: • Level of Detail in Review • Knowledge of Review Team • Comparable Database • Ability to Provide Alternatives
2. The Initial Audit • Identify the Specific Details for Facility • Energy Use (Quantity and Rates) • 24-36 Months of Energy Billing Data • Types of Processes • Types of Equipment • Treatment-Related Issues • Regulatory Requirements • Formulate Physical Audit Parameters
Facility Data • Water Source • Surface vs. Ground Water • Plant Flow/Capacity • Design, Peak, and Actual • Storage Volume • Operating Strategies • Hours, Goals, Quality
Facility Data • Facility Age • Processes • Service Community • Monthly Operating Reports • Daily Quantities, Testing, Precipitation, etc. • SCADA Data (Supervisory Control and Data Acquisition) • Contact Information
Facility Performance • Evaluate Facility Performance • Pump Curves (65-80% of Usage – IMPORTANT!) • Water Loss • Water Conservation • System Pressure • Time of Use
The RCAP Difference: • Detailed Energy Usage Summary • Understanding of Existing Equipment • Understanding of Operations and Processes
3. The Physical Audit • Evaluate Equipment • Outdated or Worn • Maintenance Important! • Life-cycle Costs • Improper Controls • Design vs. Actual Usage • Need… • Can You Eliminate? • Can You Adjust? • Can You Reduce? • More Efficient Alternative
RCAP Audit Performance • Evaluation of Facility Data • Physical Audit On-Site • Energy Auditor, Engineer, Operator • Team vs. Individual • Experience and ‘Gut’ Reactions • Interview Staff First • They know the facility the best! • Walk the Site as the Water Flows – Top to Bottom • Take Photos for Reference and Documentation
RCAP Audit Performance • Facility Analysis and Report Preparation • Follow-up with Staff as Needed • Detail Assumptions and Design Controls • Simple Payback • Findings Presentation and Next Step • Opportunities Explained • Funding Options • Incentives, Grants, Loans • Support
Consider the ‘EARTH’: • Can the Facility Do the Following: • Eliminate the Equipment? • Adjust the Equipment Size/Efficiency? • Reduce the Hours of Usage? • Talk to the Energy Providers to Re-Classify? • Habilitate for Alternative Energy Sources? • The ‘EARTH’ process can identify energy conservation opportunities (ECO’s)
‘EARTH’ and the Bulb: • Remember the 60-watt light bulb? • 10-hours per day, 5-days per week • The Demand is: 0.06 kW • The Energy Use is: 156 kWh/yr • At $0.07/kWh, the Cost is $10.92/yr • (E) – Can you Turn it Off? • (A) – Can you Reduce Wattage? • (R) – Can you use a Sensor? • (T) – Can you change T.O.U.? • (H) – Can you use Alternative Energy?
Equipment Data: • Pumps • Water Plant: • Largest Energy User (Approx. 85%) • Wastewater Plant: • Can Be Largest Energy User (Approx. 65%) • Aeration High Energy Consumption • Data to Collect: Manufacturer, Rated Capacity (GPM), Use, Pump Type, Run Time, Associated Motor, Discharge PSI, Head, Throttle/VSD, Shared, Pump Curve
Equipment Data: • Pumps • Potential Pump Combinations • 2 Smaller to meet Peak flow, can take off-line for Avg. • Minimize Losses • Friction • Head • Efficiency! • Think EARTH! • Pump Slow…Pump Long!