Download
1 / 73
740 likes | 762 Views
Learn about the history, effects, and key concepts of Employment Insurance in Canada, including labor market trends and reasons for government provision. Explore the categories of unemployment, labor force participation, and key economic factors impacting unemployment rates. Discover the important role of EI in addressing adverse selection, moral hazard, and economic cycles.

E N D
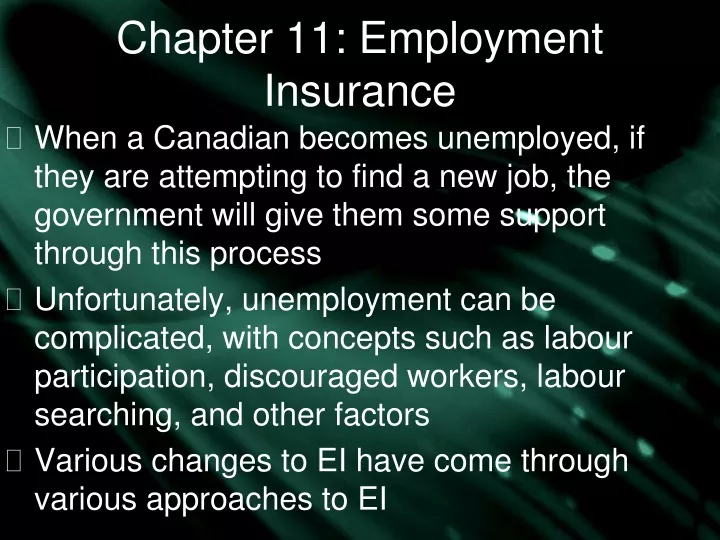
Chapter 11: Employment Insurance • When a Canadian becomes unemployed, if they are attempting to find a new job, the government will give them some support through this process • Unfortunately, unemployment can be complicated, with concepts such as labour participation, discouraged workers, labour searching, and other factors • Various changes to EI have come through various approaches to EI
Chapter 11: Employment Insurance • Unemployment in Canada • Why Employment Insurance? • History in Employment Insurance • Labour Market Effects of Employment Insurance • Distribution and Employment Insurance
History – Unemployment Insurance Expenditures • 14.5 Million Canadians covered by Unemployment Insurance in 2008-09 • $9.5 billion on regular benefits • $2.9 billion on family benefits (maternity and parental leave) • $1 billion on sickness • $246 million on fishing benefits • $1.6 billion on training, job creation, self-employment assistance, wage subsidies, and labor market agreements • 1.6 million Canadians received $14.2 Billion
Theory - Unemployment in Canada • There are 3 key categories needed to understand unemployment in Canada: Employed – workers who have a job (regardless of hours), are off work due to illness, vacation, or industrial dispute Unemployed – workers who were available for work and made an effort to find a job during the previous 4 weeks, or who were available for work and waiting to be recalled from a layoff within 26 weeks, or reporting to a new job within 4 weeks
Unemployment in Canada Labour Force = Employed +Unemployed Not in labor force = those who did not have a job and did not actively search for employment (ie: students, early retired, etc) It is important to realize there are THREE important categories.
Unemployment in Canada Labour force participation rate – labour force as a percentage of working age population Employment rate – employment as a percentage of working age population Unemployment rate – unemployment as a percentage OF LABOR FORCE -Note that discouraged workers are not considered to be in the labor force
Unemployment in Canada Unemployment depends on: • People who lose their jobs and look for a new one • People who find jobs • Unemployed who drop out of labor force (discouraged workers, students, homemakers) • People who enter labour force and look for work
“TRUE” UNEMPLOYMENT? • Should discouraged workers be considered? Discouraged Workers – individuals who have stopped looking for a job because they think that the probability of finding a job is low • Are some unemployed actually looking for work? • How do we take workers who want more hours into account? (partially unemployed) • There are even difficulties in definition
Labour Market Trends • Labour participation and employment rate has increased, due to dramatic increase in participation rate of married females • These rates have fluctuated with the economy and the unemployment rate
Unemployment Trends -Canadian unemployment has increased since the 1950’s (4.2%) -Unemployment has been decreasing since 1995 -Note the US-Can gap
Provincial Unemployment -Duration of unemployment can be as significant as unemployment rate
Country Unemployment -While Canada`s unemployment rate WAS (2009) comparable to Europe, length of unemployment was shorter -This helps workers maintain skills and self-esteem
Theory - Why Employment Insurance? Two key reasons lie behind government provision of employment insurance: • Market Failure • Adverse selection • Moral hazard • Economic cycles • Income Redistribution
1a) Adverse Selection • Some people have higher unemployment and therefore higher demand for employment insurance • ie: Young males without high school • This results in high premiums… • Which results in unappealing insurance for low risk individuals… • Which raises premiums even higher
1b) Moral Hazard • Employers can fire their workers, deciding whether they use employment insurance • Unemployed can lengthen their unemployment time, affecting the amount of EI they receive • ie: not actively looking for a new job • ie: rejecting a lower income job or job in a new area • Insurance company can`t detect this, therefore has to charge higher premiums
1c) Econ. Cycles • During a recession, employment insurance claims rise • During an expansion, employment insurance claims fall • Risk pooling can`t allow a private insurance company to survive econ cycles.
Government and Market Failure • Adverse Selection – public insurance premiums are mandatory and based on average expected loss • Benefits high risk and penalizes low risk • Moral Hazard – unavoidable, but fought through not covering initial unemployment and only covering a FRACTION of earnings • Econ Cycles – The government can better save and borrow to survive cycles
2) EI and Income Redistribution • EI naturally redistributes wealth from those who don’t suffer employment loss to those who do • Since some people have claims more often and longer claims, there is even more redistribution • IS Employment Insurance good as an income redistribution program? • There are those who agree…(next slide) • There are those who disagree…(2 slides hence)
EI and Income Redistribution YES • Employment Insurance supplements (therefore saves on) social assistance • People receiving EI may need less welfare • Some argue that Employment Insurance has less of a work disincentive than typical welfare • There is no implicit tax rate on earnings • EI requires a certain level of work, and therefore is similar to “workfare” (Osberg, 1995) • EI helps those who normally have employment while social assistance helps those who have limited ability to be self-supporting
EI and Income Redistribution NO • Employment Insurance does a poor job of redistributing income to the poor • People in equal positions are not treated equally (horizontal equity) • Tax burdens are not distributed fairly across people with different abilities to pay (vertical equity) • Employment Insurance causes major labour market distortions (firms and workers) • Because its not typical insurance
EI History – 1930’s • 1933 – 25% unemployment, 15% “on relief” • “On relief” largely covered by provincial and municipal governments • 1935 social insurance program ruled ultra vires; outside the federal government’s jurisdiction • 1867 Constitution Act amended (by federal and provincial governments) to allow for federal unemployment insurance
EI History –1940’s and 1950’s • 1940 Unemployment Insurance Act • Covered jobs with MODERATE risk of unemployment (not high risk – agriculture, forestry, fishing - or low risk – police, army, government jobs) • 42% of labour force • 50% of wage benefits, plus 15% if married • lasting for 1/5 of days worked in last 5 years, minus 1/3 of days already claimed in last 3 years • 1950’s – UI extended to seasonal workers and “self-employed” fishermen • Important move from original EI goals
EI History –1971 Reforms • 1971 Unemployment Insurance Act (Bill C-229) • Covered 93% of labor force (excluding self-employed) • Minimum eligibility – 8 weeks of work • Benefit 66% of wage, 75% with dependents • Had a maximum insurable earnings level • Sickness and maternity benefits increased • Duration linked to weeks worked in qualifying period • Increased when national unemployment exceeded 4% • Increased when regional unemployment exceeded national by 1-3% (regional extended benefits)
EI History –1971 Reform Impact • Unemployment was constant between 1971 (6.4%) and 1972 (6.3%), yet: • People covered: 5.4 million to 7.8 million • Weeks of benefits: 22.6 million to 30.5 million • Average weekly payment: $40.28 to $61.79 • Expenditure skyrocketted: • $0.890 billion to $1.87 billion • Expenditure rose from 0.9% of GNP in 1971 to 1.9% in 1975
EI History –1975 Reforms • Those who quit or were fired from misconduct couldn’t claim for 6 weeks (up from 3) • Age limit reduced to 65 years (from 70) • 75% dependent coverage eliminated (all 66%) • Increased benefits became linked to an 8 year moving average, instead of 4% trigger
EI History –1977 Reforms • New entrants, re-entrants to labor force and people with repeated claims needed more weeks of employment to qualify • Exemptions for repeat claimants in high-unemployment regions • Benefits reduced to 60% of wage (from 66%) • High income earners clawed back at 30% in net income was 1.5 times maximum insurable earnings
EI History –1980’s • Unemployment went from 7.6% (1981) to 11.9% (1983) • Benefits rose from $4.76 billion to $10.1 billion • Macdonald Royal Commission on the Economic Union and Development Prospects for Canada (1985) concluded: • UI increased unemployment rates since 1971 • Income redistribution should be replaced by a NIT The commission was opposed by Altantic Canada and labor movement and was never adopted
EI History –1980’s • 1989 Bill C-21 did some changes: • UI funds could be used for training, relocation assistance, and other employment measures • This was meant to fight long-term unemployment • Repeat users no longer had different qualification provisions • UI became entirely funded by employer and employee contributions (no general fund government funding) (as of 1991-1992)
EI History –1990’s • Unemployment rose to 11.3%, causing an UI deficit • Government increased employee and employer contributions • This may have lead to more lay-offs • 1993 benefits reduced to 57% (from 60%) • Those who quit without just cause became ineligible for UI benefits
EI History –1990’s • 1994 – UI eligibility in high unemployment regions increased to 12 weeks (from 10) • 20 weeks was required in other regions • Benefits could last from 17 to 50 weeks depending on weeks worked and regional unemployment • Benefit reduced to 55% (from 57%) • But raised to 60% for low-income recipients with dependents • Employee contributions increased again
EI History –1996 Reforms • 1996 Employment Insurance Act (Bill C-12) made major changes in: • Eligibility • EI Benefits • Duration of Benefits • Intensity Rule • Financing
1) Eligibility • 1996 Employment Insurance Act eligibility: • Eligibility based on HOURSof last 52 weeks • 420-700, depending on unemployment rate • 910 hours for new entrants to labor force and those entering after 2 years • 600 hours for sickness, maternity, or parental benefits • Fishing benefits depend on earnings in a fishing season ($2500 to $4200 depending on regional unemployment) • This change took part time work and seasonal work into account much better
2) EI Benefits • 55% of insurable earnings, to a maximum of $39,000 (reduced from $42,380) • This held constant until 2006 • Maximum Insurable Earnings (MIE) $44,200 in 2011 • Low-income claimants with children can get a Family Supplement to increase their benefits to 80% (family income less than $25,921) • 5.9% of EI claimants received this supplement • Incomes exceeding $48,750 repay 30% of benefits
3) Duration of Benefits • 2 week waiting period • 50 maximum weeks (reduced to 45 weeks recently) • 15 weeks maternity or sickness benefits • 10 week parental benefits (increased to 35 weeks in 2000) • Temporary extensions put in place in 2009
4) Intensity Rule • Benefit rate was reduced by 1% (maximum 5%) for every 20 weeks of regular or fishing benefits • Intended to discourage repeated EI use • Eliminated in 2000
5) Financing • 2010 Contribution rates are $1.73 for employees and $2.42 for employers for every $100 insurable earnings • MIE $43,200 • Employer rate is 1.4 times employee rate • Maximum $730 for an employee and $1,024 for an employer per year
EI Today • Insurance: • Premium financing • Payouts when unemployed • Redistribution: • Benefit clawbacks for high incomes • Variable entrance requirements • Family Supplement • Self-Employed fishermen benefits
Theory - Labour Market Effects of EI • Employees and employers can influence EI claims (Moral Hazard) • Studies on the relationship between EI and Unemployment have been inconclusive (Corak 1994) • EI has so many factors, it is hard to gauge its ``generosity`` • Many other factors also affect the labor market (oil prices, interest rates, recession, etc)
Labour Market Effects of EI • The labour market effects of the Canadian Employment Insurance System can be divided into: • Direct Effects – effects on labor market dynamics (ie: employment flow chart, slide 9) a) layoffs b) quits c) duration of employment d) labour force participation)
Labour Market Effects of EI 2) Systemic Effects - changes to the economic environment a) industrial mix b) labour mobility c) education 3) Macroeconomic Effects (automatic stabilizing effects)
1) Direct Effects • Layoffs and hiring are caused by: • Seasonal variations in demand (not insurable, as they are highly predictable) • Business cycle fluctuations in demand (main focus of EI) • Long term changes in the economy (requires retraining)
1a) Layoffs • From 1983 to 1999, • Permanent layoffs occurred in 5.7% (1999) to 7.7% (1983) of jobs • Temporary layoffs occurred in 7.3% (1989) to 9.7% (1992) of jobs • Additional workers quit • EI can distort a firm`s layoff decision:
1a) Layoffs • When a firm needs to cut costs, including labour, it can reduce hours or lay off • With EI, laying off (which has EI support) is more attractive than reducing hours (which has no EI support) • Therefore, typical EI encourages layoffs • EI Work-Sharing Programs (started in 1982) allow reduced hours and EI to discourage layoffs
1a) Layoffs • Some firms may design job length according to minimum EI work requirements • Green and Riddell (1995) found an increase in EI requirements from 10 to 14 weeks of work in high unemployment regions in 1990: 1) REDUCED unemployment and 2) increased average length of employment
1b) Quits • Prior to 1993, workers who quit got UI in Canada but not the states, resulting in: • Equal job quitting in Canada and the US • 20.6 weeks average unemployment in Canada • 11.2 weeks average unemployment in US • (Baker et al, 1996) • If EI applies to quitters, the unemployment rate is increased by longer job searches