Download

1 / 75
780 likes | 862 Views
Dive into consumer theory to explore the demand curve, income consumption curve, Engel curve, and market demand. Learn how prices and income influence consumer choices and optimal decision-making. Example scenarios and algebraic derivations provide practical insights.

E N D
Chapter 5 – The Theory of Demand • Thus far we have studied supply and demand and their equilibrium • In this chapter we will see how consumer theory creates the demand curve • Shifts in demand will be dissected and consumer choices will be investigated further
Chapter 5 – The Theory of Demand • In this chapter we will study: 5.1 Price Consumption Curve 5.2 Deriving the Demand Curve 5.3 Income Consumption Curve 5.4 Engel Curve 5.5 Substitution and Income Effects 5.6 Consumer Surplus
Chapter 5 – The Theory of Demand 5.7 Compensating & Equivalent Variation 5.8 Market Demand 5.9 Labor and Leisure 5.10 Consumer Price Index (CPI)
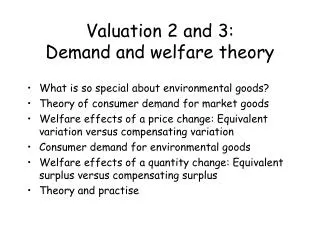
Demand and Optimal Choice Y (units) At a given income and faced with prices Px and Py,an individual will maximize their utility given the Tangency condition, resulting in a consumption of Good x as seen below: 10 • PX = 4 X (units) 0 XA=2 XB=10
Demand and Optimal Choice Y (units) When the price of x decreases, a consumer will maximize given the new budget line and a new amount of x will be consumed. 10 • • PX = 2 PX = 4 X (units) 0 XA=2 XB=10 20
5.1 The Price Consumption Curve Y (units) The price consumption curve for good x plots all the utility maximization points as the price of x changes. This reveals an individual’s demand curve for good x. 10 Price consumption curve • • • PX = 1 PX = 2 PX = 4 X (units) 0 XA=2 XB=10 XC=16 20
Example: Individual Demand Curve for X PX The points found on the price consumption curve produce the typically downward-sloping demand curve we are familiar with. • PX = 4 • PX = 2 • U increasing PX = 1 X XA=2 XB=10 XC=16
5.2 Deriving the Demand Curve Algebraically, we can derive an individual’s demand using the following equations: a) Pxx + Pyy = I (budget constraint) b) MUx/Px = MUy/Py (tangency point) 1) Solve (b) for y 2) Substitute y from (b) into (a) 3) Solve for x
General Example: Suppose that U(x,y) = xy. MUx = y and MUy = x. The prices of x and y are Px and Py, respectively and income = I. • x/Py = y/Px • y = xPx/Py • 2) Pxx + Py(Px/Py)x = I • Pxx + Pxx = I • 3) x= I/2Px
Specific Demand Example Let U=xy, therefore MUx=y and MUy=x Let income=12, Py=1. Graph demand as Px increases from $1 to $2 to $3. Step 1: Pxx+Pyy=I Pxx+y=12 Step 2: MUx/MUy=Px/Py y/x=Px y=Pxx
Demand Example Step 1: Pxx+y=12 Step 2: y=Pxx Step 3: Pxx+Pxx=12 x=6/Px X(1)=6 X(2)=3 X(3)=2
PX Demand Example Maximizing at each point, we arrive at the following demand curve: • PX = 3 • PX = 2 U increasing • PX = 1 X 2 3 6
Y (units) Demand, Choice and Income At a given income, a consumer maximizes using tangency as seen below: 10 • I = 10 X (units) 0 XA=2 XB=10
Y (units) Demand, Choice, and Income When income increases the budget line shifts out, resulting in a new equilibrium 10 • • I=12 I = 10 X (units) 0 XA=2 20 XB=3
5.3 The Income Consumption Curve Y (units) The income consumption curve for good x plots all the utility maximization points as income changes. This is shown by shifting the demand curve for x. 10 Income consumption curve • • • X (units) 0 20
The Income Consumption & Demand Curves Y (units) I=92 I=68 U3 Income consumption curve I=40 U2 U1 0 X (units) 10 18 24 PX $2 I=92 I=68 I=40 10 18 24 X (units)
5.4 The Engel Curve The income consumption curve for good x also can be written as the quantity consumed of good x for any income level. This is the individual’s Engel Curve for good x. When the income consumption curve is positively sloped, the slope of the Engel curve is positive.
I ($) Engel Curve Graph “X is a normal good” Engel Curve 92 68 40 X (units) 0 10 18 24
Normal and Inferior Goods • If the income consumption curve shows that the consumer purchases more of good x as her income rises, good x is a normal good. • Equivalently, if the slope of the Engel curve is positive, the good is a normal good. •If the income consumption curve shows that the consumer purchases less of good x as her income rises, good x is an inferior good. • Equivalently, if the slope of the Engel curve is negative, the good is an inferior good.
Normal and Inferior. • Some goods are normal or inferior over different income levels Example: Kraft Dinner a) at extreme low incomes, Kraft dinner consumption goes up as income increases (because starving is bad) -Kraft Dinner is a normal good at extreme low incomes b) as income rises, people substitute away from Kraft Dinner to “real foods” -Kraft dinner is an inferior good at most incomes
Y (units) Example: I=400 A good can be normal over some ranges and inferior over others I=300 U3 I=200 U2 U1 0 X (units) 13 16 18 I ($) Example: Backward Bending Engel Curve 400 Engel Curve 300 200 X (units) 13 16 18
5.5 Substitution and Income Effects When the price of a good decreases, two effects occur: 1) The good is cheaper compared to other goods; consumers will substitute the cheaper good for more expensive goods 2) Consumers experience an increase in purchasing power similar to an increase in income
Income Effect • Definition: As the price of x falls, all else constant, purchasing power rises. This is called the income effect of a change in price. • The income effect may be negative (normal good) or positive (inferior good).
Substitution Effect: As the price of x falls, all else constant, good x becomes cheaper relative to good y. This change in relative prices alone causes the consumer to adjust his/ her consumption basket. This effect is called the substitution effect. • The substitution effect always is negative Usually, a move along a demand curve will be composed of both effects. • Graphically, these effects can be distinguished as follows…
Y (units) Example: Normal Good: Income and Substitution Effects BL2 Let Px decrease BL1 A • C • • B U2 BLd U1 Substitution Income X (units) 0 XA XB XC
Y (units) Example: Inferior Good: Income and Substitution Effects BL2 “X is an inferior good” • C BL1 A • U2 BLd B • U1 Income Substitution XA XC XB X (units) 0
Finding the DECOMPOSITION Budget Line The decomposition budget line (BLd) that satisfies 2 conditions: 1) The budget line represents a change in the price ratio; it must be parallel to the new budget line (BL2) 2) The budget line must be tangent to the old indifference curve (U1)
Y (units) Budget line slopes Slope of B1 = -Px1/Py Slope of B2 = -Px2/Py Slope of Bd = -Px2/Py BL2 BL1 A • C • BLd • B U2 U1 Substitution Income X (units) 0 XA XB XC
Steps to Finding Substitution and Income Effects: • Using initial prices (and tangency), find • start point (xa, ya) • start utility (Ua) • Using final prices (and tancency), find • end point (xc, yc) • end utility (Uc)
Steps to Finding Substitution and Income Effects: 3) Using final prices and start utility for • decomposition point (xb, yb) 4) Solve: a) Substitution Effect: xB-xA b) Income Effect: xC-xB
Substitution and Income Effect Example: • Suppose U(x,y) = 2x1/2 + y. • MUx = 1/x1/2MUy = 1. • Py = $1 and I = $10. • Suppose that Px = $0.50. What is the (initial) optimal consumption basket? • Tangency Condition: • MUx/MUy = Px/Py • 1/x1/2 = Px
Solving for x: x = 1/(Px2) x = 1/(0.5)2 x = 4 Substituting, xA = 4 into the budget constraint: Pxx + Pyy = 10 0.5(4) + (1)y = 10 yA = 8 UA = 2xA1/2 +yA UA=2(41/2)+8 UA=12
2) Suppose that px = $0.20. What is the (final) optimal consumption basket? Using the demand derived in (a), x = 1/(Px2) xc = 1/(0.2)2 xc = 25 Pxx + Pyy = 10 0.2(25) + (1)y = 10 yC =5 • UC=2xC1/2+yC • UC=2(251/2)+5 • UC=15
3) What are the substitution and income effects that result from the decline in Px? • Decomposition basket (New Prices, Old Utility) • Tangency: • MUx/MUy = Px/Py • 1/x1/2 = .2 • xb=25 U = 2x1/2 + y 12 = 2(25)1/2 + y yB = 2 Substitution Effect: xB-xA = 25 - 4 = 21 Income Effect: xC-xB = 25 - 25 = 0
Giffen Goods If a good is so inferior that the net effect of a price decrease of good x, all else constant, is a decrease in consumption of good x, good x is a Giffen good. • For Giffen goods, demand does not slope down. • When might an income effect be large enough to offset the substitution effect? The good would have to represent a very large proportion of the budget. (Some economists debate the existence of Giffen Goods)
Y (units) Example: Giffen Good: Income and Substitution Effects BL2 “X is a Giffen good” C • BL1 A U2 • • B Income U1 Substitution X (units) 0 XC XA XB
5.6 Consumer Surplus • The individual’s demand curve can be seen as the individual’s willingness to pay curve. • On the other hand, the individual must only actually pay the market price for (all) the units consumed. • For example, you may be willing to pay $40 for a haircut, but upon arriving at the stylist, discover that the price is only $30 • The difference between willingness to pay and the amount you pay is the Consumer Surplus
Example: Consumer's Surplus Definition: The net economic benefit to the consumer due to a purchase (i.e. the willingness to pay of the consumer minus the actual price) is called consumer surplus. The area under an ordinary demand curve and above the market price provides a measure of consumer surplus. Note that a consumer will receive more surplus from the first good than from the last good.
Consumer Surplus Equilibrium Or market Price Consumer Surplus Consumer Surplus: The difference between what a consumer is willing to pay and what they pay for each item Price P* D Quantity Q*
Consumer Surplus (This calculation Only works for A linear demand curve) Efficiency of the Equilibrium Quantity Price Consumer Surplus = area of triangle =1/2bh =1/2(16-8)(10) =40 $16 $8 D Quantity 10
Consumer Surplus Example 1 Craig’s demand for model cars is given by the demand curve P=20-Q. If model cars cost $10 each, how much consumer surplus does Craig have? P=20-Q 10=20-Q 10=Q, Craig buys 10 model cars Consumer Surplus =1/2bh =1/2(10)(20-10) =50
5.7 Compensating and Equivalent Variation • In practice, a consumer’s demand curve is difficult to estimate • Consumer Surplus can be estimated using the optimal choice diagram (budget lines and indifference curves) • Since utility is difficult to measure, consumer surplus is measured through the money needed when a price change occurs:
Compensating and Equivalent Variation COMPENSATING VARIATION: The minimum amount of money a consumer must be compensated after a price increase to maintain the original utility. -The consumer’s ORIGINAL Utility is important. EQUIVALENT VARIATION: The change in money to give a equivalent utility to a price change. -The consumer’s FINAL Utility is important.
Compensating Variation Y (units) -A change in the price of x shifts BL1 to BL2 -Consumption moves from point A to point C -A BL at new prices that would maintain original utility is parallel to BL2 N • A C -NM represents the money required to return a consumer to their original utility, consuming at B (if Py=1) • M U2 B • U1 BL2 BL1 X (units) O
Equivalent Variation Y (units) Q -A change in the price of x shifts BL1 to BL2 -Consumption moves from point A to point C -A BL at old prices that would make the equivalent move to the new utility is parallel to BL1 D • N • A • C -NQ represents the money equivalent to a price change, resulting in consumption at D (if Py=1) U2 U1 BL2 BL1 X (units) O
Y (units) Compensating and Equivalent Variation Q -Here a price DECREASE occurs -MN is the max amount a consumer would PAY for this price decrease -NQ is the amount a consumer would be PAID instead of a price decrease D • N • A B • M U2 • C U1 BL2 BL1 X (units) O
CV and EV Steps • Calculate ORIGINAL and NEW consumption points that maximize utility. (Use tangency condition.) • Calculate ORIGINAL and NEW utility. • 3a) Compensating Variation: • With ORIGINAL UTILITY and NEW PRICES, minimize expenditure ECV • CV=I-ECV • 3b) Equivalent Variation: • With FINAL UTILITY and ORIGINAL PRICES, minimize expenditure EEV • EV=EEV-I
Consumer Surplus Example 2 Hosea’s utility demand for mini xylophones and yogurt (x and y) is represented by U=x2+y2 MUx=2x MUy=2y. Hosea has $20. Mini xylophones originally cost $2 while yogurt cost $1. Due to an outbreak of mad xylophone disease, price of healthy mini xylophones decreased to $1 each. Calculate compensating and equivalent variation.
Consumer Surplus Example 2 Originally (at point A): MUx/Px=MUy/Py 2x/2=2y/1 2X=4Y X=2Y PxX+PyY=I 2X+Y=20 5Y=20 Y=4 X=2Y X=8 After price change (at point C): MUx/Px=MUy/Py 2x/1=2y/1 X=Y PxX+PyY=I X+Y=20 X=10 X=Y Y=10
Consumer Surplus Example 2 Originally (at point A): Y=4 X=8 U(A) =42+82 =16+64 =80 After price change (at point C): X=10 Y=10 U(B) =102+102 =100+100 =200 Decrease in price causes an increase in utility. Here we have maximized utility given a budget constraint.