Download
1 / 67
670 likes | 692 Views
Learn about electrical conductance, resistance, conductivity, and the effects of imperfections and temperature on metals and semiconductors. Explore band structures, resistivity, relative permittivity, and electron transport in materials.

E N D
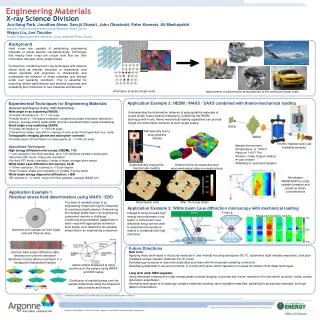
EED2013 Engineering Materials Non-Mechanical Properties of Materials
Overview Electrical Properties Magnetic Properties Thermal Properties Durability
Electrical Properties ISSUES TO ADDRESS... • How are electrical conductance and resistance characterized? • What are the physical phenomena that distinguish conductors, semiconductors, and insulators? • For metals, how is conductivity affected by imperfections, temperature, and deformation? • For semiconductors, how is conductivity affected by impurities (doping) and temperature?
View of an Integrated Circuit (a) (d) Al (d) Si (doped) 45mm 0.5mm • A dot map showing location of Si (a semiconductor): -- Si shows up as light regions. (b) • A dot map showing location of Al (a conductor): -- Al shows up as light regions. (c) Figs. (a), (b), (c) from Fig. 18.27, Callister & Rethwisch 8e. • Scanning electron micrographs of an IC: Fig. (d) from Fig. 12.27(a), Callister & Rethwisch 3e. (Fig. 12.27 is courtesy Nick Gonzales, National Semiconductor Corp., West Jordan, UT.)
Electrical Conduction • Resistivity, r: -- a material property that is independent of sample size and geometry surface area of current flow current flow path length • Conductivity, s • Ohm's Law: V = I R voltage drop (volts = J/C) C = Coulomb resistance (Ohms) current (amps = C/s)
Electrical Properties • Which will have the greater resistance? • Analogous to flow of water in a pipe • Resistance depends on sample geometry and size. 2 D 2D
J = (V/ ) Electron fluxconductivityvoltage gradient Definitions Further definitions J= <= another way to state Ohm’s law J current density electric field potential = V/
Conductivity: Comparison CERAMICS Soda-lime glass 10 -9 Concrete 10 -13 Aluminum oxide <10 SEMICONDUCTORS POLYMERS -14 -4 Polystyrene <10 Silicon 4 x 10 -15 -10 -17 -11 0 Polyethylene 10 -10 -10 Germanium 2 x 10 -6 GaAs 10 insulators semiconductors • Room temperature values (Ohm-m)-1 = ( - m)-1 METALS conductors 7 Silver 6.8 x 10 7 Copper 6.0 x 10 7 Iron 1.0 x 10 Selected values from Tables 18.1, 18.3, and 18.4, Callister & Rethwisch 8e.
Example: Conductivity Problem What is the minimum diameter (D) of the wire so that V < 1.5 V? I = 2.5 A + - Cu wire V 100 m < 1.5 V 2.5 A 6.07 x 10⁷ (Ohm-m)-1 Solve to get D > 1.87 mm
Relative Permittivity, εr • Property governs the electro-static charge stored on an electric capacitor. • The main equation that this is found is: C = εoεrA/d where C = capacitance in Farads A = area of the capacitor plate d = distance between the capacitor plates εo = absolute permittivity (8.85 x 10⁻¹²)
Relative Permittivity, εr Here is a table of some example values of εr:
Band Structure Representation Adapted from Fig. 18.3, Callister & Rethwisch 8e.
Partially filled band Overlapping bands Energy Energy empty band empty GAP band partly filled filled band band filled states filled states filled filled band band Conduction & Electron Transport • Metals (Conductors): -- for metals empty energy states are adjacent to filled states. -- thermal energy excites electrons into empty higher energy states. -- two types of band structures for metals - partially filled band - empty band that overlaps filled band
Energy Band Structures: Insulators & Semiconductors • Semiconductors: -- narrow band gap (< 2 eV) -- more electrons excited across band gap empty empty Energy conduction conduction band band ? GAP filled valence band filled states filled band • Insulators: -- wide band gap (> 2 eV) -- few electrons excited across band gap Energy GAP filled valence band filled states filled band
6 r • Resistivity increases with: Cu + 3.32 at%Ni 5 Ohm-m) 4 -- temperature deformed Cu + 1.12 at%Ni Resistivity, -- wt% impurity 3 Cu + 1.12 at%Ni d -8 -- %CW 2 (10 i = thermal “Pure” Cu 1 t + impurity 0 -200 -100 0 T (ºC) + deformation Adapted from Fig. 18.8, Callister & Rethwisch 8e. (Fig. 18.8 adapted from J.O. Linde, Ann. Physik5, p. 219 (1932); and C.A. Wert and R.M. Thomson, Physics of Solids, 2nd ed., McGraw-Hill Book Company, New York, 1970.) Metals: Influence of Temperature and Impurities on Resistivity • Presence of imperfections increases resistivity -- grain boundaries -- dislocations -- impurity atoms -- vacancies These act to scatter electrons so that they take a less direct path.
Adapted from Fig. 18.9, Callister & Rethwisch 8e. 180 50 r 160 Ohm-m) 40 140 125 30 30 Resistivity, 120 Yield strength (MPa) -8 20 100 (10 21 wt% Ni 10 80 0 60 0 10 20 30 40 50 0 10 20 30 40 50 wt% Ni, (Concentration C) wt% Ni, (Concentration C) From step 1: CNi = 21 wt% Ni Estimating Conductivity • Question: -- Estimate the electrical conductivity of a Cu-Ni alloy that has a yield strength of 125 MPa. Adapted from Fig. 7.16(b), Callister & Rethwisch 8e.
Charge Carriers in Insulators and Semiconductors Two types of electronic charge carriers: Free Electron – negative charge – in conduction band Hole – positive charge – vacant electron state in the valence band Adapted from Fig. 18.6(b), Callister & Rethwisch 8e. Move at different speeds - drift velocities
Intrinsic Semiconductors • Pure material semiconductors: e.g., silicon & germanium • Group IVA materials • Compound semiconductors • III-V compounds • Ex: GaAs & InSb • II-VI compounds • Ex: CdS & ZnTe • The wider the electronegativity difference between the elements the wider the energy gap.
• Concept of electrons and holes: valence electron hole electron hole Si atom electron pair creation pair migration - - + + no applied applied applied • Electrical Conductivity given by: # holes/m3 hole mobility electron mobility # electrons/m3 Intrinsic Semiconduction in Terms of Electron and Hole Migration electric field electric field electric field Adapted from Fig. 18.11, Callister & Rethwisch 8e.
for intrinsic semiconductor n = p = ni = ni|e|(e+ h) • Ex: GaAs For GaAs ni = 4.8 x 1024 m-3 For Si ni = 1.3 x 10¹⁶ m-3 Number of Charge Carriers Intrinsic Conductivity
Intrinsic Semiconductors: Conductivity vs T • Data for Pure Silicon: -- s increases with T -- opposite to metals material Si Ge GaP CdS band gap (eV) 1.11 0.67 2.25 2.40 Selected values from Table 18.3, Callister & Rethwisch 8e. Adapted from Fig. 18.16, Callister & Rethwisch 8e.
Intrinsic vs Extrinsic Conduction 4 + 4 + 4 + 4 + 4 + 4 + 4 + 4 + 4 + 4 + 4 + 4 + 4 + 4 + • n-type Extrinsic: (n >> p) • p-type Extrinsic: (p >> n) 4 + 4 + 4 + 4 + 4 + 4 + 4 + 4 + Phosphorus atom Boron atom hole conduction electron 5+ 3 + valence electron no applied no applied Si atom Adapted from Figs. 18.12(a) & 18.14(a), Callister & Rethwisch 8e. electric field electric field • Intrinsic: -- case for pure Si -- # electrons = # holes (n = p) • Extrinsic: -- electrical behavior is determined by presence of impurities that introduce excess electrons or holes -- n ≠ p
doped undoped 3 2 freeze-out extrinsic intrinsic concentration (1021/m3) Conduction electron 1 0 0 200 400 600 T (K) Adapted from Fig. 18.17, Callister & Rethwisch 8e. (Fig. 18.17 from S.M. Sze, Semiconductor Devices, Physics, and Technology, Bell Telephone Laboratories, Inc., 1985.) Extrinsic Semiconductors: Conductivity vs. Temperature • Data for Doped Silicon: -- s increases doping -- reason: imperfection sites lower the activation energy to produce mobile electrons. • Comparison:intrinsic vs extrinsic conduction... -- extrinsic doping level: 1021/m3 of a n-type donor impurity (such as P). -- for T < 100 K: "freeze-out“, thermal energy insufficient to excite electrons. -- for 150 K < T < 450 K: "extrinsic" -- for T >> 450 K: "intrinsic"
p-n Rectifying Junction + - + - + + - - + - p-type - n-type + + + - + - - + - - + n-type - p-type + + - - + + - + - + - • Allows flow of electrons in one direction only (e.g., useful to convert alternating current to direct current). • Processing: diffuse P into one side of a B-doped crystal. p-type n-type -- No applied potential: no net current flow. Adapted from Fig. 18.21 Callister & Rethwisch 8e. -- Forward bias: carriers flow through p-type and n-type regions; holes and electrons recombine at p-n junction; current flows. -- Reverse bias: carriers flow away from p-n junction; junction region depleted of carriers; little current flow.
Properties of Rectifying Junction Fig. 18.22, Callister & Rethwisch 8e. Fig. 18.23, Callister & Rethwisch 8e.
Summary • Electrical conductivity and resistivity are: -- material parameters -- geometry independent • Conductors, semiconductors, and insulators... -- differ in range of conductivity values -- differ in availability of electron excitation states • For metals, resistivity is increased by -- increasing temperature -- addition of imperfections -- plastic deformation• For pure semiconductors, conductivity is increased by -- increasing temperature -- doping [e.g., adding B to Si (p-type) or P to Si (n-type)] • Other electrical characteristics -- ferroelectricity -- piezoelectricity
Magnetic Properties ISSUES TO ADDRESS... • What are the important magnetic properties? • How does magnetic memory storage work?
Generation of a Magnetic Field -- Vacuum • Computation of the applied magnetic field, H: • Created by current through a coil: B0 N = total number of turns = length of each turn (m) I= current (ampere) H H= applied magnetic field (ampere-turns/m) B0 = magnetic flux density in a vacuum (tesla) I • Computation of the magnetic flux density in a vacuum, B0: B0=0H permeability of a vacuum(1.257 x 10⁻⁶ Henry/m)
Generation of a Magnetic Field -- within a Solid Material • Relative permeability (dimensionless) • A magnetic field is induced in the material B B = Magnetic Induction (tesla) inside the material applied magnetic field H B=H permeability of a solid current I
Relative Permeability, μr • Property that governs the magnetic strength of a material. • The main equation that this property occurs is B/H = μoμr where B = flux density in Tesla H = magnetising force μo = absolute permeability (12.566 x 10⁻⁷)
Types of Magnetism (3) ferromagnetic e.g. Fe3O4, NiFe2O4 (4) ferrimagnetic e.g. ferrite(), Co, Ni, Gd cm (2) paramagnetic ( e.g., Al, Cr, Mo, Na, Ti, Zr ~ 10-4) cm ( as large as 106 !) cm (1) diamagnetic ( ~ -10-5) cm vacuum ( = 0) e.g., Al2O3, Cu, Au, Si, Ag, Zn B (tesla) H (ampere-turns/m) Plot adapted from Fig. 20.6, Callister & Rethwisch 8e. Values and materials from Table 20.2 and discussion in Section 20.4, Callister & Rethwisch 8e.
(2) paramagnetic random aligned Adapted from Fig. 20.5(b), Callister & Rethwisch 8e. (3) ferromagnetic (4)ferrimagnetic Adapted from Fig. 20.7, Callister & Rethwisch 8e. aligned aligned Magnetic Responses for 4 Types No Applied Applied Magnetic Field (H = 0) Magnetic Field (H) (1) diamagnetic opposing Adapted from Fig. 20.5(a), Callister & Rethwisch 8e. none
Domains in Ferromagnetic & Ferrimagnetic Materials H H H • “Domains” with aligned magnetic H moment grow at expense of poorly aligned ones! H H = 0 • As the applied field (H) increasesthe magnetic domains change shape and size by movement of domain boundaries. B sat Adapted from Fig. 20.13, Callister & Rethwisch 8e. (Fig. 20.13 adapted from O.H. Wyatt and D. Dew-Hughes, Metals, Ceramics, and Polymers, Cambridge University Press, 1974.) induction (B) Magnetic 0 Applied Magnetic Field (H)
Hysteresis and Permanent Magnetization Stage 2. Apply H, align domains Stage 3. Remove H, alignment remains! => permanent magnet! Stage 4. Coercivity, HCNegative H needed to demagnitize! Stage 6. Close the hysteresis loop Stage 5. Apply -H, align domains • The magnetic hysteresis phenomenon B Adapted from Fig. 20.14, Callister & Rethwisch 8e. H Stage 1. Initial (unmagnetized state)
Hard and Soft Magnetic Materials Hard Soft Hard magnetic materials: -- large coercivities -- used for permanent magnets -- add particles/voids to inhibit domain wall motion -- example: tungsten steel -- Hc = 5900 amp-turn/m) B H Soft magnetic materials: -- small coercivities -- used for electric motors -- example: commercial iron 99.95 Fe Adapted from Fig. 20.19, Callister & Rethwisch 8e. (Fig. 20.19 from K.M. Ralls, T.H. Courtney, and J. Wulff, Introduction to Materials Science and Engineering, John Wiley and Sons, Inc., 1976.) 35
Magnetic Storage • Digitized data in the form of electrical signals are transferred to and recorded digitally on a magnetic medium (tape or disk) • This transference is accomplished by a recording system that consists of a read/write head -- “write” or record data by applying a magnetic field that aligns domains in small regions of the recording medium -- “read” or retrieve data from medium by sensing changes in magnetization Fig. 20.23, Callister & Rethwisch 8e.
Magnetic Storage Media Types • Hard disk drives (granular/perpendicular media): -- CoCr alloy grains (darker regions) separated by oxide grain boundary segregant layer (lighter regions) -- Magnetization direction of each grain is perpendicular to plane of disk Fig. 20.25, Callister & Rethwisch 8e. (Fig. 20.25 from Seagate Recording Media) 80nm ~ 500nm -- Tabular (plate-shaped) ferrimagnetic barium-ferrite particles • Recording tape (particulate media): Fig. 20.24, Callister & Rethwisch 8e. (Fig. 20.24 courtesy Fuji Film Inc., Recording Media Division) ~ 500nm -- Acicular (needle-shaped) ferromagnetic metal alloy particles
Summary • A magnetic field is produced when a current flows through a wire coil. • Magnetic induction (B): -- an internal magnetic field is induced in a material that is situated within an external magnetic field (H). -- magnetic moments result from electron interactions with the applied magnetic field • Types of material responses to magnetic fields are: -- ferrimagnetic and ferromagnetic (large magnetic susceptibilities) -- paramagnetic (small and positive magnetic susceptibilities) -- diamagnetic (small and negative magnetic susceptibilities) • Types of ferrimagnetic and ferromagnetic materials: -- Hard: large coercivities -- Soft: small coercivities • Magnetic storage media: -- particulate barium-ferrite in polymeric film (tape) -- thin film Co-Cr alloy (hard drive)
Thermal Properties ISSUES TO ADDRESS... • How do materials respond to the application of heat? • How do we define and measure... -- heat capacity? -- thermal expansion? -- thermal conductivity? -- thermal shock resistance? • How do the thermal properties of ceramics, metals, and polymers differ?
Heat Capacity • Two ways to measure heat capacity:Cp : Heat capacity at constant pressure. Cv: Heat capacity at constant volume. Cpusually > Cv • Heat capacity has units of The ability of a material to absorb heat • Quantitatively: The energy required to produce a unit rise in temperature for one mole of a material. energy input (J/mol) heat capacity (J/mol-K) temperature change (K)
Dependence of Heat Capacity on Temperature • Heat capacity... -- increases with temperature -- for solids it reaches a limiting value of 3R Cv= constant 3R R = gas constant = 8.31 J/mol-K Cv Adapted from Fig. 19.2, Callister & Rethwisch 8e. 0 T (K) 0 q D Debye temperature ) (usually less than T room • From atomic perspective: -- Energy is stored as atomic vibrations. -- As temperatureincreases, the average energy of atomic vibrations increases.
Atomic Vibrations Atomic vibrations are in the form of lattice waves or phonons Adapted from Fig. 19.1, Callister & Rethwisch 8e.
cp (J/kg-K) at room T Material • Polymers cp(specific heat): (J/kg-K) 1925 Polypropylene 1850 Polyethylene 1170 Polystyrene 1050 Teflon • Ceramics Magnesia (MgO) 940 Alumina (Al2O3) 775 Glass 840 • Metals Aluminum 900 Steel 486 Selected values from Table 19.1, Callister & Rethwisch 8e. Tungsten 138 Gold 128 Specific Heat: Comparison Cp(heat capacity): (J/mol-K) • Why is cpsignificantly larger for polymers? increasing cp
Thermal Expansion Materials change size when temperature is changed Tinitial initial Tfinal> Tinitial Tfinal final linear coefficient of thermal expansion (1/K or 1/ºC)
Symmetric curve: -- increase temperature, -- no increase in interatomic separation -- no thermal expansion Atomic Perspective: Thermal Expansion Asymmetric curve: -- increase temperature, -- increase in interatomic separation -- thermal expansion Adapted from Fig. 19.3, Callister & Rethwisch 8e.
a (10-6/C)at room T Material • Polymers Polypropylene 145-180 Polyethylene 106-198 Polystyrene 90-150 Teflon 126-216 • Metals Aluminum 23.6 Steel 12 increasing Tungsten 4.5 Gold 14.2 • Ceramics Magnesia (MgO) 13.5 Alumina (Al2O3) 7.6 Soda-lime glass 9 Silica (cryst. SiO2) 0.4 Coefficient of Thermal Expansion: Comparison Polymers have larger values because of weak secondary bonds • Q: Why does a generally decrease with increasing bond energy? Selected values from Table 19.1, Callister & Rethwisch 8e.
Answer: For Cu rearranging Equation 19.3b Thermal Expansion: Example Ex: A copper wire 15 m long is cooled from 40 to -9ºC. How much change in length will it experience?
Thermal Conductivity The ability of a material to transport heat. Fourier’s Law temperature gradient heat flux (J/m2-s) thermal conductivity (J/m-K-s) T2 T1 T2>T1 x1 x2 heat flux • Atomic perspective: Atomic vibrations and free electrons in hotter regions transport energy to cooler regions.
Aluminum 247 Steel 52 Tungsten 178 Gold 315 • Ceramics Magnesia (MgO) 38 Alumina (Al2O3) 39 increasing k atomic vibrations Soda-lime glass 1.7 Silica (cryst. SiO2) 1.4 • Polymers Polypropylene 0.12 Polyethylene 0.46-0.50 vibration/rotation of chain molecules Polystyrene 0.13 Teflon 0.25 Thermal Conductivity: Comparison Energy TransferMechanism Material k (W/m-K) • Metals atomic vibrations and motion of free electrons Selected values from Table 19.1, Callister & Rethwisch 8e.
Thermal Stresses • Occur due to: -- restrained thermal expansion/contraction -- temperature gradients that lead to differential dimensional changes Thermal stress