Download
1 / 23
280 likes | 532 Views
Long-term correction of wind measurements State-of-the-art, guidelines and future work. Sónia Liléo, Erik Berge, Ove Undheim, Rickard Klinkert and Rolv E. Bredesen. EWEA 2013. This study was partly financed by KVT and partly by Vindforsk III.

E N D
Long-term correction of wind measurements State-of-the-art, guidelines and future work Sónia Liléo, Erik Berge, Ove Undheim, Rickard Klinkert and Rolv E. Bredesen EWEA 2013
This studywaspartlyfinanced by KVT and partly by Vindforsk III. Vindforsk III is a Swedish research programmerelated to wind power, financed by the following partners: ”Long-term correction of windmeasurements. State-of-the-art, guidelines and future work.”, Liléo et al., Elforsk report 13:18, 2013 www.vindteknikk.se Final report available in the followinglink:
2. Long-term reference data Onlyreanalysis datasets havebeenanalyzed. 2.1. Analysis of the representativeness of somereanalysis datasets • Short-termsitemeasurements • Data from 42 masts at sites with lowcomplexity Performed study 3. Long-term correctionmethods Different commonlyused LTC methodshavebeenanalyzed. 3.1. Self-predictionanalysis 3.2. Dependence on the measurement period length 4. Past as predictor of the future • 4.1. Analysis of the pastwindclimate • 4.2. Dependence on the reference period length 5. Long-term correctedwind speed 5.1. Uncertaintyanalysis
2.1. Analysis of therepresentativeness of some reanalysis datasets Reanalysis global datasets
2.1. Analysis of the representativeness of some reanalysis datasets Reanalysis global datasets Reanalysis mesoscale datasets
2.1. Analysis of the representativeness of some reanalysis datasets – Hourly basis The hourly corr. coef. measures how well the temporal variations of the measured wind speed agree in phase with the temporal variations in the reference wind speed. MERRA data appears to give a more accurate description of the temporal variations of the wind speed on a hourly basis. 0.5◦ x 0.7◦ 0.75◦ x 0.75◦ 0.5◦ x 0.5◦ 0.05◦ x 0.05◦ 0.04◦ x 0.04◦
2.1. Analysis of the representativeness of some reanalysis datasets – Monthly basis • Very similar monthly correlation coefficients obtained for the different datasets. • All the datasets appear to describe equally well the monthly variations of the wind speed. 0.5◦ x 0.5◦ 0.75◦ x 0.75◦ 0.05◦ x 0.05◦ 0.04◦ x 0.04◦ 0.5◦ x 0.7◦
2. Long-term reference data Onlyreanalysis datasets havebeenanalyzed. 2.1. Analysis of the representativeness of somereanalysis datasets • Short-termsitemeasurements • Data from 42 masts at sites with low complexity • Removal of erroneous data Performed study • 3. Long-term correctionmethods • Different commonlyused LTC methodshavebeenanalyzed. • 3.1. Self-predictionanalysis • 3.2. Dependence on the measurement period length 4. Past as predictor of the future • 4.1. Analysis of the pastwindclimate • 4.2. Dependence on the reference period length 5. Long-term correctedwind speed 5.1. Uncertaintyanalysis
3.2. Self-prediction analysis of different LTC methods • Reference data • Chosen amongERA-Interim, CFSR/CFSv2, MERRA, WRF FNL and WRF ERA-Interim • Reference data that gives the largesthourlycorr. coef. with the wind speed measurements. • Site data • Windmeasurements from 16 different masts • Morethan 24 months of data • Data coverage > 85 % • Hourlycorrelationcoefficient, R, with the reference data > 80 % Prediction error 100 We have tested all LTC methods available through WindFarmer (GL GH), WindPRO (EMD) and in-house developed methods.
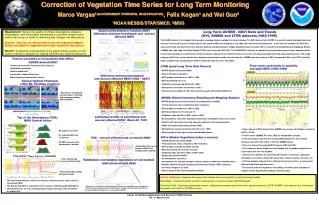
3.1. Self-prediction analysis The predictionerror is 1.5 to 2 % in average for the tested LTC methods . Normal variation up to 4 %. The ranking shown in this figure is not statisticallysignificant. Resultsobtainedusing 1 year of sitewindmeasurements
3.2. Dependence on the measurement period length • The increase of the measurement period lengthfrom 1 to 2 years reduces the average prediction error from 1.5-2 % to a level close to 1 %. The prediction error is seen to increase when slightly more than 1 and than 2 years of measurements are used. This might be related to a bias introduced by the unequal representation of each month.
2. Long-term reference data Onlyreanalysis datasets havebeenanalyzed. 2.1. Analysis of the representativeness of somereanalysis datasets • Short-termsitemeasurements • Data from 42 masts at sites with low complexity • Removal of erroneous data Performed study • 3. Long-term correctionmethods • Different commonlyused LTC methodshavebeenanalyzed. • 3.1. Self-predictionanalysis • 3.2. Dependence on the measurement period length 4. Past as predictor of the future 4.1. Analysis of the pastwindclimate 4.2. Dependence on the reference period length 5. Long-term correctedwind speed 5.1. Uncertaintyanalysis
4.1. The past wind climate according to 20CRv2 data • The region analyzedincludes Norway, Sweden, Denmark, Finland and the Baltic countries. The period 1989 to 1995 was characterized by unusual high annual mean wind speeds associated with a large positive peak in the NAO index.
4.2. Dependence on the reference period length Future period Const. length: 20y Moving period Reference period Varyinglength: 1 to 30 years Moving period
4.2. Dependence on the reference period length The assumption of the past being a predictor of the future mean wind speed is associated with a typical prediction error of about 1.5 to 2 %, provided that a reference period length of 15-20 years is chosen. The choice of a 15 to 20 years long reference period appears to minimize the prediction error. Length of the reference period (years)
2. Long-term reference data Onlyreanalysis datasets havebeenanalyzed. 2.1. Analysis of the representativeness of somereanalysis datasets • Short-termsitemeasurements • Data from 42 masts at sites with low complexity • Removal of erroneous data Performed study • 3. Long-term correctionmethods • Different commonlyused LTC methodshavebeenanalyzed. • 3.1. Self-predictionanalysis • 3.2. Dependence on the measurement period length 4. Past as predictor of the future 4.1. Analysis of the pastwindclimate 4.2. Dependence on the reference period length 5. Long-term correctedwind speed 5.1. Uncertaintyanalysis
Conclusions - How large is the resultant total uncertainty? Based on cases with a hourly corrcoef between measurements and reference data > 80 %
NCEP/NCAR for the development of the R1 reanalysisproject. • NOAA/OAR/ESRL PSD, Boulder, Colorado, USA, for providing NCEP Reanalysis derived data via their webpage. • The Japan Meteorological Agency (JMA) and the Central Research Institute of Electric Power Industry (CRIEPI) for the development of the JRA-25 long-term reanalysis cooperative research project. • ECMWF for the development of the ERA-Interim reanalysis project. • Global Modeling and Assimilation Office (GMAO) and the GES DISC (Goddard Earth Sciences Data and Information Services Center) for the dissemination of MERRA. • NCEP for the development of the CFSR reanalysisproject and for the production of CFSv2 data. • The U.S. Department of Energy, Office of Science Innovative and Novel Computational Impact on Theory and Experiment (DOE INCITE) program, Office of Biological and Environmental Research (BER), and the National Oceanic and Atmospheric Administration (NOAA) Climate Program Office for providing support to the Twentieth Century Reanalysis Project (20CR). • The Research Data Archive (RDA) which is maintained by the Computational and Information Systems Laboratory (CISL) at the National Center for Atmospheric Research (NCAR) for providing data access via their webpage to a large number of datasets. NCAR is sponsored by the National Science Foundation (NSF). The CFSR, CFSv2 and 20CRv2 datasets used in this study were retrieved from RDA. Acknowledgements
Thanks for your attention! Final report availablethrough the followinglink: www.vindteknikk.se ”Long-term correction of windmeasurements. State-of-the-art, guidelines and future work.”, Liléo et al., Elforsk report 13:18, 2013 Welcome to the Poster 1154! Knut Harstveit and Rickard Klinkert Long-term reference datasets. Shouldweprefer modelled mesoscale datasets or measured data from synopticweather stations?