Download
1 / 29
320 likes | 528 Views
13: Examining Relationships in Quantitative Research. Relationships between Variables. Is there a relationship between the two variables we are interested in? How strong is the relationship? How can that relationship be best described?. Covariation and Variable Relationships.

E N D
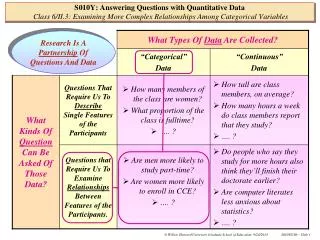
Relationships between Variables • Is there a relationship between the two variables we are interested in? • How strong is the relationship? • How can that relationship be best described?
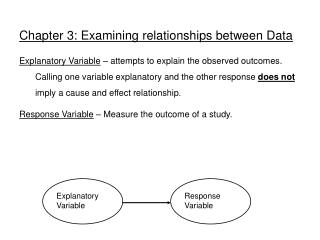
Covariation and Variable Relationships • Covariation is amount of change in one variable that is consistently related to the change in another variable • A scatter diagram graphically plots the relative position of two variables using a horizontal and a vertical axis to represent the variable values
Correlation Analysis • Pearson Correlation Coefficient (r) – measures the strength of a linear relationship between two metric variables • Varies between – 1.00 and +1.00 • The higher the absolute value of the correlation coefficient, the stronger the level of association • Positive sign – direct relationship • Negative sign – inverse relationship • Check for significance – p < .05 good, but consider “marginal” cases
Assumptions for Pearson’s Correlation Coefficient • The two variables are assumed to have been measured using interval or ratio-scaled measures • Nature of the relationship to be measured is linear (NOT curvilinear or other) • Variables come from normally distributed populations
Substantive Significance • Coefficient of Determination (R-squared) measures the proportion of variation in one variable accounted for by another • The r2 measure is a percentage varying from 0.0 to 1.00 • The larger the r2, the stronger the linear relationship between the two variables under study • Explained and unexplained variation
Relationships Between Variables Measured with Rank (Ordinal) Scales Spearman Rank Order Correlation Coefficient is a statistical measure of the linear association between two variables where both have been measured using ordinal (rank order) scales
Regression Analysis • A method for arriving at more mathematically detailed relationships (predictions) than those provided by the correlation coefficient • Assumptions • Variables are measured on interval or ratio scales • Variables come from a normal population • Error terms are normally and independently distributed
Formula for a Straight Regression Line y = a + bX + ei y = the dependent variable a = the intercept b = the slope X = the independent variable used to predict y ei = the error for the prediction
Fitting the Regression Line Using the “Least Squares” Procedure
Ordinary Least Squares (OLS) OLS is a statistical procedure that estimates regression equation Coefficients ( ‘a’ and ‘b’) which produce the lowest sum of squared differences between the actual and predicted values of the dependent variable
Key Terms in Regression Analysis • Adjusted R-square • Explained vs. Unexplained variance • Regression coefficient • F-Test • Regression Significance • Coefficient Significance
Significance of Regression Coefficients • Answers these questions: • Is there a relationship between the dependent and independent variable? • How strong is the relationship? • p- or t- values are indicators of relationship strength and significance • Look for p < .05, but consider “marginal” cases
Multiple Regression Multiple regression analysis is a statistical technique which analyzes the linear relationship between a dependent variable and multiple independent variables by estimating coefficients for the equation of a straight line
Beta Coefficient A StandardizedBeta Coefficientis an estimated regression coefficient that has been recalculated to have a mean of 0 and a standard deviation of 1 in order to enable independent variables with different units of measurement to be directly compared on their association with the dependent variable
Evaluating a Regression Analysis • Assess the statistical significance of the overall regression model using the F statistic and its associated p-value • Evaluate the regression’s R-squared • Examine the individual regression coefficients and their t-test statistics (or their p-values) to see which are statistically significant • Look at values of the beta coefficients to assess relative influence of each predictor (IV) on Dependent Variable (DV)
Multicollinearity Multicollinearity is when several independent variables are highly correlated with each other. This causes difficulty in accurately estimating the regression coefficients of the correlated variables.
Multicollinearity – How to Avoid • Eliminate or replace highly correlated IVs • Perform a correlation matrix • Typically search for correlations higher than .5 in absolute value • Factor Analysis Techniques (also called “Principal Components Analysis”) • “Live with it”