Download
1 / 4
50 likes | 214 Views
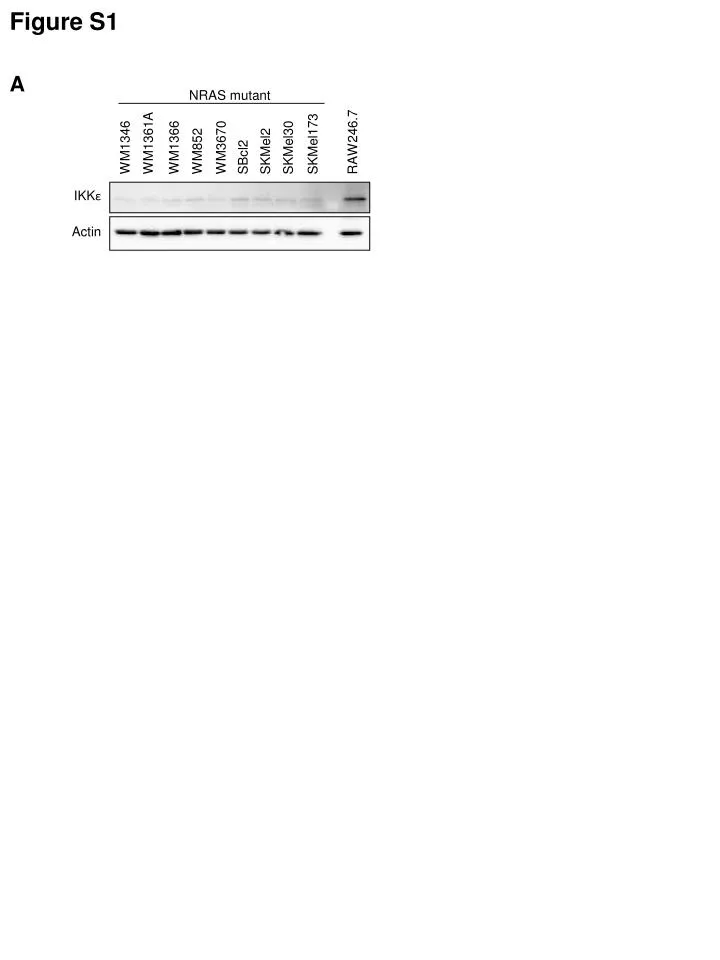
Figure S1. A. NRAS mutant. SKMel30. WM1366. WM3670. SKMel2. SKMel173. WM1346. WM1361A. WM852. RAW246.7. SBcl2. IKK ε. Actin. Figure S2. A. WM1366 WM1346. - #2 - #2. siTBK1. TBK1. ERK. B. 100. siCTL. siTBK1 #2. 80. *. *. *. *. 60.

E N D
Figure S1 A NRAS mutant SKMel30 WM1366 WM3670 SKMel2 SKMel173 WM1346 WM1361A WM852 RAW246.7 SBcl2 IKKε Actin
Figure S2 A WM1366 WM1346 - #2 - #2 siTBK1 TBK1 ERK B 100 siCTL siTBK1 #2 80 * * * * 60 Percent Migration of Control 40 20 0 SBcl2 WM1346 WM1361A WM1366 siCTL siTBK1 C 100 siCTL siTBK1 #2 80 * * 60 Percent Invasion of Control * 40 * 20 0 WM1346 WM1361A WM1366 SBcl2 siCTL siTBK1
Figure S3 WM1366 TR TBK1-myr SKMel2 0 0.01 0.1 1 5 AZ909 (μM) 0 0.01 0.1 1 5 PDK1 phospho-PDK1 Ser241 Aurora A Thr288 phospho-Aurora A/B/C Aurora B Thr222 Aurora C Thr198 Aurora A Aurora B IKKε
Figure S4 A B C AZD6244 DMSO WM1366 siTBK1 siTBK1 WM1366 siCTL siCTL siTBK1 AZD56244 AZ909 AZD6244 - - + + - + - + - - + + - + - + Bim-EL Bim-EL Mcl-1 Mcl-1 Bmf Bmf