Download
1 / 36
360 likes | 546 Views
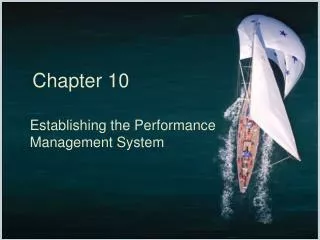
Improving Website Performance: Top Ten Actions for Optimal Performance. Lloyd W. Taylor VP Technology & Operations Keynote Systems. Poor Performance Hurts your Site. Crash!. Virtually Offline (> 30 sec.). Web Site Response Time. Unacceptable (15 – 30 sec.). Borderline (9 – 15 sec.).

E N D
Improving Website Performance:Top Ten Actions for Optimal Performance Lloyd W. Taylor VP Technology & Operations Keynote Systems
Poor Performance Hurts your Site Crash! Virtually Offline (> 30 sec.) Web Site ResponseTime Unacceptable (15 – 30 sec.) Borderline (9 – 15 sec.) The 8 Second Barrier Good (0 - 8 sec.) Web Site Load (Number of concurrent users)
And Your Revenue! Transactions per Hour
Most users click away after 8 second delay Most users click away after 8 second delay Most users click away after 8 second delay $4.4 billion in revenue lost annually due to poor web performance $4.4billion in revenue lost annually due to poor web performance Source: Zona Research Source: Zona Research Source: Zona Research The Reality
The “Eight Second” Rule • Popularized by Zona Research in Apr 1999 • http://www.keynote.com/services/wp_downloadspeed.doc • Showed rapid increase in abandonment rate after 8 seconds • < 8 seconds 6-8% abandonment • > 8 seconds 30%+ abandonment! • But, that info is almost two years old
“8 Second Rule” Published by Zona 2.85 Seconds!
The New Rule? • KB40 was ~ 8 seconds when the report was published • KB40 is now ~ 3 seconds • Are our customers abandoning faster than they used to? • Zona is updating their report. Stay Tuned!
Lost & Unhappy Customers Realistic load test results: 32 Average Response Time (sec) 16 8 Number Of Users = Completed = Attempted = Satisfied Time
The Reality • Boston Consulting Group Survey of 12,000 U.S. • Online Shoppers (March 2000) • Reasons for Lost/Failed Transactions • 48% “Pages took so long to load that I gave up” • 45% “Site was so confusing that I couldn't find product” • 26% “System crashed (got logged off) before completion”
The Internet Performance Problem WebServer ExternalThird PartyContent WebBrowser Router LoadBalancer FTP Servere-Mail ServerApplication ServerDatabases StreamingServer
Internet Performance Model User Experience Time Page Size Min BW Turns * Delay Processing Time = + +
Page Size / Min Bandwidth • Page Size is the TOTAL size of your page • Including images, JavaScript, banners • Minimum Bandwidth is the “smallest pipe” between your content and your customer • Not just the size of your pipe to the Internet! • Default Windows RWIN setting will be limiting factor for broadband connections • TCP Slowstart will be limiting factor for small objects
The RWIN Problem - 1 • TCP Receive Window Size (RWIN) limits maximum throughput for Home/Desktop PC users • As soon as the webserver sends RWIN bytes, it stops until it gets an ACK from the browser • Windows RWIN default is 8KB • Typical Webserver can send 8KB in less than 1mS, and then must wait for an ACK
The RWIN Problem - 2 • Effect on Throughput • Max Thruput = RWIN/Latency • Example: 200mS RT latency, 8KB RWIN • Max Download Throughput of 328Kb/S • Actual Results of RWIN change: • @Home connection, 8K RWIN: 450KB/s • @Home connection, 64K RWIN: 1.6MB/s • http://www.dslreports.com/tweaks/RWIN
Effect of Small RWIN • It is more important to reduce latency than to improve server performance • Getting the content close to the customer is the only way to do this • HTTP 1.1 will be affected more than HTTP 1.0 • Short streams don’t usually hit RWIN limit • Long streams do
TCP Slowstart • TCP Slowstart is a congestion avoidance mechanism that is part of TCP/IP • When a server sends data to a client, it starts by sending one packet, and waiting for an ACK • Then is sends two, waits for an ACK, then four, etc., up to the RWIN size • If a packet is lost, the sender immediately cuts the send rate in half, then starts ramping up again
Effect of Slowstart • Objects that are bigger than one packet size will be delivered more slowly than expected • Typical packet size is ~1500 bytes • HTTP 1.0 will be affected more than HTTP 1.1 • Once a stream is started, there won’t be another Slowstart penalty unless a packet is lost
Page Size / Min Bandwidth • A 100KB page will take at least • 20 seconds @ 40Kb/s • 0.8 second @ 1Mb/s • Performance may be significantly slower due to • RWIN limits in high-latency connections • TCP Slowstart if the 100KB page is made of many small objects
Turns * Delay • “Turns” is the number of round trips across the network that are required to download the complete page • For HTTP 1.0, number of turns is 3 + (2 * #Objects) • [DNS – 1, TCPOpen – 1, HTTP Get - 1] • Typical browser allows 4 simultaneous connections, so 4 turns can happen at once • “Delay” is the round-trip latency of the path between the server and the client
What’s a Turn? Start SYN TCP Open turn SYN-ACK ACK HTTP GET turn ACK ACK End
Turns * Delay – 2 • So, a rough estimate of download time for HTTP 1.0 attributable to turns and delay is: DTTD = Delay * (3 + (2 * #Objects/4)) DNS – 1 Base Page -2
Turns*Delay Example – Local 0.26 Sec 23 Objects
Turns*Delay Example – Dist. 3.22 Sec 23 Objects
Turns*Delay Example – Local 4 Objects 0.46 Sec
Turns*Delay Example – Dist. 4 Objects 0.83 Sec
Processing Time • Time for the server to process the request • Static HTML • Dynamic content (ASP, CGI) • Backend systems (database) • Time for client to process the data • Rendering • Java/shock/etc.
Optimizing Your Site • The “Top Ten” Things that you can do to optimize web site performance
Content Optimizations 10. The smaller the page, the faster the site • Carefully trade off size with content • Consider your end users – Business, Consumer, Consumer at Work • Anything much bigger than 40KB TOTAL will significantly increase abandons by dialup users • Eliminate White Space in HTML Code • Minimum Bandwidth is end-to-end! • Minimum Dialup latency is 600mS • Force Developers to test over dialup!
Content Optimizations - 2 9. Reduce the number of objects • Each additional object adds delay by increasing the number of turns required 8. Don’t use Java • The JVM can take several seconds to start on the client – time which counts against the ‘8 second rule’
Content Optimizations - 3 7. Hold your banner provider accountable • Those banners are typically served from outside your farm, but count against you in user perception • Set up an SLA with teeth, and use a third-party firm to measure compliance
Server Optimizations 6. Build a “Load Shedding” Site • When System Load exceeds a threshold, switch heavily-used pages to a reduced-size version 5. Load Test! • You don’t know what your server can handle until you try it. • Test all backend systems using transaction testing. • Use a load test product that models your user’s behavior.
Server Optimizations -2 4. Put in LOTS of RAM • Memory is cheap. Put in a lot of it, and make sure your server software is configured to use it ALL. 3. Use Load-Balanced Servers • Load Balancers have become quite sophisticated, and can greatly improve the performance of your site when properly used.
Network Optimizations 2. Use a Content Delivery Network • CDNs work by reducing the Delay part of the Turns*Delay equation • The more objects you have, the more you need a CDN • The more users you have, the more you need a CDN • CDNs also help with flash crowds • Set up an SLA with teeth, and use a third-party firm to measure compliance
Most Important Of All 1. Measure Performance From the Perspective of Your End Users • What works well in your datacenter may not work well when viewed over dialup or from International locations • Continually measure not only your front end servers, but also set up measurements that exercise your back-end servers
Thank You! www.keynote.com 1-800-KEYNOTE