Download
1 / 26
270 likes | 466 Views
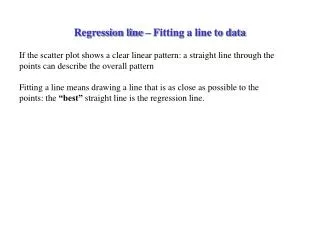
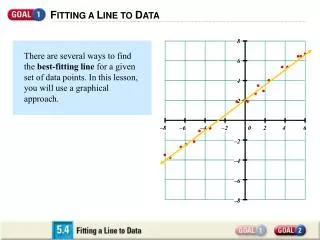
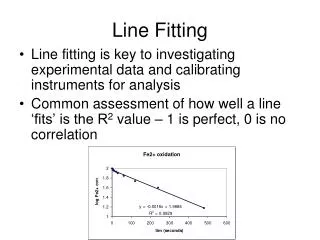
Fitting a Line to a Set of Points. Scatterplot fitting a line. Least squares method Minimize the error term e. y (dependent). x (independent). n. S (y - ŷ) 2. n. S (y i - a - bx i ) 2. min a,b. min a,b. =. i = 1. i = 1. Minimizing the SSE ( Sum of Squared Errors ). n.

E N D
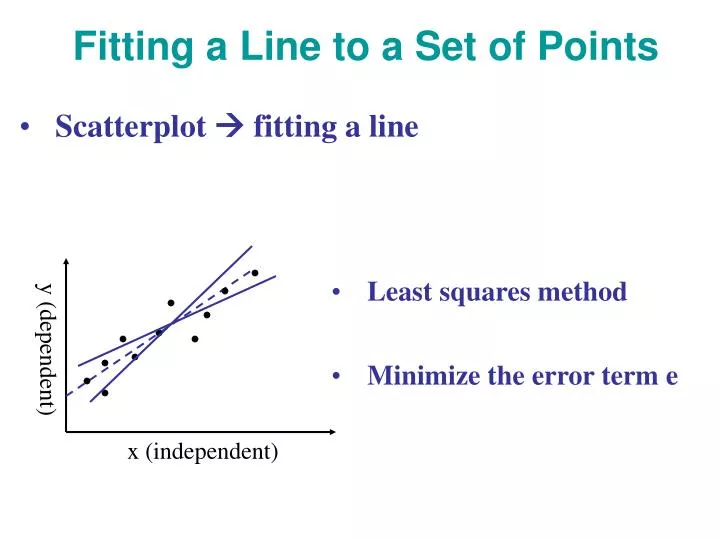
Fitting a Line to a Set of Points • Scatterplot fitting a line • Least squares method • Minimize the error term e y (dependent) x (independent)
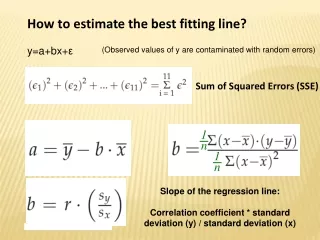
n S(y - ŷ)2 n S(yi - a - bxi)2 min a,b min a,b = i = 1 i = 1 Minimizing the SSE(Sum of Squared Errors)
n S(xi - x) (yi - y) i = 1 b = n S(xi - x)2 i = 1 a = y - bx Finding Regression Coefficients • Least squares method
(b) (a) y y x x Coefficient of Determination (r2) • Numerical measure to express the strength of the relationship • coefficient of determination (r2)
y n n SSR = S(ŷi - y)2 SST = S(yi - y)2 i = 1 i = 1 SSR r2 = SST Coefficient of Determination (r2) • Regression sum of squares (SSR) • Total sum of squares (SST) • Coefficient of determination (R2)
n n = S(ŷi - y)2 SST = S(yi - y)2 i = 1 i = 1 n + S(yi - ŷ)2 y SSE SST i = 1 SSR Partitioning the Total Sum of Squares SST = SSR + SSE
F MSSR MSSE n n n S(yi - y)2 S(ŷi - y)2 S(yi - ŷ)2 i = 1 i = 1 i = 1 Regression ANOVA Table Sum of Squares Component Regression (SSR) Error (SSE) Total (SST) df 1 n - 2 n - 1 Mean Square SSR / 1 SSE / (n - 2)
Regression Example Excel
Regression ANOVA table Sum of Degrees of Mean Component Squares Freedom Square F-Test Regression (SSR) Error (SSE) Total (SST)
r2 (n - 2) MSSR Ftest = = MSSE 1 - r2 A Significance Test for r2 F-distribution with degrees of freedom: df = (1, n - 2)
Assumptions of Regression • The relationship is linear • y = a + bx + e • Not linear (scatterplot) transform one or both of the variables
Assumptions of Regression • The errors have a mean of zero and a constant variance • i.e. the errors need to distributed evenly on either side of the regression line • The magnitude of their dispersion has to be reasonably constant for all values of x • Variation in the errors is larger for some values of x than others a linear model is not appropriate
Assumptions of Regression • 3. Residuals • Independent • No pattern in the distribution • Pattern • the model is not effectively capturing some systematic aspect of the relationship • Another factor cannot be accounted for by this model
n (yi - ŷ)2 S se = (n - 2) i = 1 Significance Tests for Regression Parameters • t-tests • significance of individual regression parameters • Standard error of the estimate • also known as the standard deviation of the residuals (se):
b ttest = sb se2 sb = (n - 1) sx2 Significance Test for Slope (b) • H0: b = 0 sb is the standard deviation of the slope parameter: df = (n - 2)
Hypothesis Testing - Significance Test for Regression Slope Example
a ttest = sa Sxi2 se2 sa = nS(xi - x)2 Significance Test for Regression Intercept where sa is the standard deviation of the intercept: and degrees of freedom = (n - 2)
Hypothesis Testing - Significance Test for Regression Intercept Example
Simple Linear Regression in Excel • Built-in functions • SLOPE(array1, array2) • INTERCEPT(array1, array2) • Data Analysis Tool
S-Plus TVDI (x) 0.274 0.542 0.419 0.286 0.374 0.489 0.623 0.506 0.768 0.725 Theta (y) 0.414 0.359 0.396 0.458 0.350 0.357 0.255 0.189 0.171 0.119 TVDI 0.413 0.223 0.811 0.513 0.655 0.354 0.198 0.763 0.671 0.424