Download
1 / 32
320 likes | 526 Views
Nano-chemical mapping performed by an AFM-based (“AFMIR”) acousto-optic technique and applications. A. Dazzi, F. Glotin, C. Mayet, J.-M. Ortega , R. Prazeres CLIO/LCP - Université Paris Sud - France. Why infrared ?. Many species have a characteristic absorption spectrum

E N D
Nano-chemical mapping performed by an • AFM-based (“AFMIR”) acousto-optic technique and applications A. Dazzi, F. Glotin, C. Mayet, J.-M. Ortega, R. Prazeres CLIO/LCP - Université Paris Sud - France
Why infrared ? • Many species have a characteristic absorption spectrum • (“chemical signature”) • Molecules (vibrations) • Pseudo-atoms and molecules (defects in solids, nanostructures) • Elementary excitations in solids (plasmons, Cooper pairs...) Linear spectroscopy : Performed with blackbody sources and synchrotron radiation Non-Linear spectroscopy : Performed with lasers, particularly pulsed lasers Microspectroscopy : Resolution > l/2 : performed with blackbody sources and synchrotron radiation Resolution << l/2 : performed with lasers tunable IR FEL
Infrared microspectroscopy The infrared microspectroscopy associates lateral resolution (“microscopy”) and IR spectral analysis (“chemical identification”) Classical sources provide lateral resolution > l/2 Laser sources + near-field techniques should provide resolution << l (illumination of small objects requires beam of sufficient brightness) • Near-field techniques : • Fully optical methods (SNOM, PSTM, apertureless...) • New photo-acoustic method (“AFMIR”) to overcome • the problems encountered with usual means
Example of a near-field method : the PSTM (photon scanning microscope) Optical fiber The electric field above the sample is sampled by the tip (< l) of an infrared transmitting optical fiber (1st method used at CLIO in1995)
Disadvantages of all-optical near-field High spatial resolution (<< l) requires a very small thickness of the sample (<< l) --> Therefore the optical contrast becomes very small (< 1 %) (necessarily pulsed) tunable lasers do not allow observation of such low contrasts Moreover, there is no general method to separate the contributions from : - The real part of n = index of refraction (topography, inhomogeneities) - The imaginary part of n = optical absorption :desired quantity Differential methods are needed : photoacoustics
The photothermal effect CLIO IR light
deflection F Detection of dilatation Diode laser 4 quadrant detector AFM cantilever dilatation
A new method : « AFMIR » • A commercial AFM is used • The sample is irradiated in PSTM configuration • An IR absorption results in a local dilatation • This dilatation is recorded by optical detection of the tip motion • The transient character of the dilatation (due to the pulsed nature of the laser) ==> spatial resolution • The topography is recorded at the same time
Test experiment Amide I Amide II Amide III ADN Bacteria Escherichia coli Typical size : 2-6 µm long 1-2 µm large and 500 nm height FT-IR spectrum AFM microscopy
Temporal response Tip Tip s=1650cm-1 (amide I) E.coli
Tip Temporal response s=1800cm-1 (out of bands) E.coli
Tip Tip Temporal response s=1650cm-1 (amide I) E.coli Time (µs)
Fourier analysis s=1650cm-1 Resonances on E.coli Resonances on ZnSe
Localised spectroscopy 66 kHz Tip FT-IR AFMIR FFT amplitude (nm) Absorbance
Chemical mapping s=1800 cm-1 AFM topography
Chemical mapping s=1650 cm-1 AFM topography
Example of light distribution in tree different bacteria : a) height=100 nm width = 1.5µm b) height=210 nm width = 1.5µm c) height=450 nm width = 2µm
Mapping of amide I on a thin spectrally homogeneous sample(nearly homogeneous lighting) Topography AFMIR
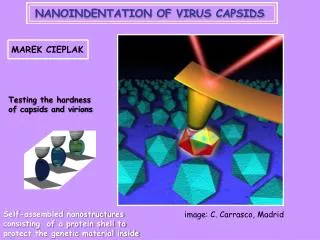
Virus T5 infecting E. Coli bacteria • Most of its weight is constituted by DNA • It has a protein envelope : capsid • The virus injects its DNA in the bacterium through its tail • The DNA is replicated inside the infected cell • New capsids are synthesized • The process can be stopped at any stage • Cells were dried in this experiment
Observation of an isolated virus T5 (Amide I band at 1650 cm-1 : capsid) AFM AFMIR
Observation of isolated virus T5 (DNA band at 1050 cm-1 : the dried virus has expelled its DNA and looks diluted) AFM AFMIR
Observation of an heavily infected bacterium Topography (AFM) AFMIR (bande de l’ADN)
Observation of a single virus infecting a bacterium AFMIR (ADN bande) Topographie (AFM)
Zooming on the single virus
First experiments living cells (in water)(on candida albicans cells) Frequency response of the cantilever : On the cell in air In water : on the cell (red) on substrate (blue) ==> selecting the peak frequency (31,6 MHz) allows to image the cell
AFM topography Mapping in water of living cells (candida albicans glued on the substrate) Wavelength : 1080 cm-1 AFMIR Topography at 80 kHz AFMIR Topography at 31.6 kHz
Why is the observed spatial resolution so good ? • AFMIR spatial resolution is < 100 nm • limited by tip size, sample characteristics, S/N ratio • One expect heat diffusion of @1 µm/µs (speed of sound) • Measurement is done in more than tens of µs • ===> surprising that resolution << 1 µm • Simulations show that the heat is diluted in • the substrate and in air • ===> Almost no signal outside the absorbing zone
COMSOL simulation of cooling of an hemispherical object ==> After excitation of the cantilever vibration, the heat is diluted extremely rapidly in the substrate (but too many excited samples on the substrate can “pollute” the signal”)
COMSOL simulation of transient dilatation around the virus The spatial resolution is limited at @ 200 nm in the case of the « buried » virus
Application : absorption nanospectroscopy of a single quantum dot Excitation 800 nm InAs/GaAs self-assembled quantum dot Quantum dots are “buried” and cannot be observed by AFM Density : 400 dots per µm2 20 nm diameter n-type doping Resonant absorption in the mid-infrared Single quantum dot absorption @ room temperature lexc = 9.6 µm Measurement performed with CLIO + AFMIR Spatial resolution ~ 80 nm J. Houel, S. Sauvage, P. Boucaud
Conclusion:AFMIR + CLIO/OPO capabilities • Powerful tool to measure local relative absorption • Good spectral resolution (fit well FT-IR spectrum) • High spatial resolution (< 100 nm << linfrared) • Various applications underway