Download
1 / 126
1.29k likes | 1.62k Views
Overview of the Dvorak Technique. Visible and Infrared Technique Simplified Visible Technique given here (See Technical Report for full details) Uses patterns and measurements as seen on satellite imagery to assign a number (T number) representative of the cyclone’s strength.

E N D
Overview of the Dvorak Technique • Visible and Infrared Technique • Simplified Visible Technique given here (See Technical Report for full details) • Uses patterns and measurements as seen on satellite imagery to assign a number (T number) representative of the cyclone’s strength. • The T number scale runs from 0 to 8 in increments of 0.5.
Overview of the Dvorak Technique Cont’d • In the following examples, only the Data T Number (DT) will be calculated, the final (official) T number assigned to a tropical cyclone includes further considerations. • DT computations familiarize one to various tropical cyclone patterns.
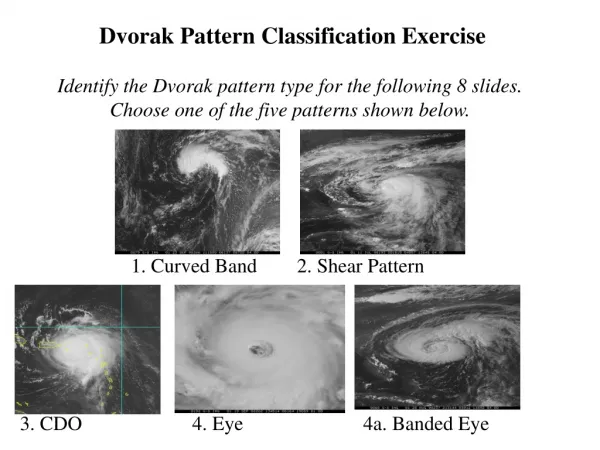
Four Basic Patterns • Curved Band Pattern • Shear Pattern • Central Dense Overcast (CDO) Pattern • Eye Pattern
Finding the Cloud System Center (CSC) • First step in the Dvorak technique • From Dvorak (1985): “The cloud system center is defined as the focal point of all the curved lines or bands of the cloud system. It can also be thought of as the point toward which the curved lines merge or spiral.” • Several situations
Curved Band Pattern • DT number determined by curvature of band around 10 log spiral
Curved Band Pattern Cont’d 1.0 to 2.0 2.5 3.0 3.5 4.0 4.5 DT Number
Curved Band Pattern • Tropical Storm Ivan curves 0.7 around log 10 spiral. This corresponds to DT=3
Shear Pattern DT Numbers 1° latitude = 60 nautical miles (nmi) = 111 km
CDO • No eye • DT number determined by CF+BF=DT • CF=CENTRAL FEATURE • BF=BANDING FEATURE • DT=DATA T NUMBER
Example: CDO Central Feature (CF) • Measure Diameter of CDO in degrees latitude • For a well defined CDO • 3/4 ° CF=2 • 1 1/4 ° CF=3 • 1 3/4 ° CF=4 • >2 1/4 ° CF=5 • For an irregular CDO • 1° to 1 1/2 ° CF=2 • >1 1/2 ° CF=3
Eye Pattern • DT number determined by CF+BF=DT • CF=CENTRAL FEATURE • BF=BANDING FEATURE • DT=DATA T NUMBER
Example: Eye - Central Feature (CF) • CF=E-number+Eye Adjustment • E-number a measure of the hurricane’s radius in degrees latitude • 1/4° E-no.=3 • 1/2° E-no.=4 • 3/4° E-no.=5 • 1° E-no.=6 • >1° E-no.=7
Eye - Central Feature Cont’d • Eye adjustment 1. Poorly defined or ragged eyes: Subtract 0.5 for E-no. 4.5 and 1 for E-no. 5. 2. Large eyes: Limit T-no. to T6 for round, well defined eyes, and to T5 for large ragged eyes. 3. For MET 6, 0.5 or 1 may be added to DT for well defined eye in smooth CDO when DT < MET.
Example: Eye - Banding Feature (BF) ( Same as with CDO)
Data T Number CF + BF = DT CF = 6 - 1 = 5 BF = 0.5 DT = 5.5
Infrared (IR) Technique • Can be used during night as well as during day • At times more objective than visible technique
Example Digital IR: Hurricane Erika 1515 UTC 8 September 1997 • Warmest eye pixel 16 °C • Warmest pixel 30 nmi (55 km) from center -71 °C • Nomogram gives Eye no. =7
Summary • The Dvorak technique uses patterns and measurements from satellite imagery to estimate the strength of a tropical cyclone. • Four basic types • Curved band pattern • Shear pattern • CDO pattern • Eye pattern
ODT-Objective Dvorak Technique • Original version – Dvorak (1984) – “analysis using digital IR data” • Velden, Olander, Zehr (1998) – ODT • Computation used for hurricane intensities remains essentially unchanged • What is it? – Two IR temperature measurements, given a center location
Two IR temperature measurements • 1) Surrounding temperature – Warmest pixel from those located on r=55 km circle • 2) Eye temperature – Warmest pixel within the eye • Table assigns intensity to nearest 0.1 T-No. • Intensity increases as Surrounding T gets colder and as the Eye T gets warmer.
Isidore’02 vs Lili’02 • Lowest MSLP • Isidore’02 934 hPa • Lili’02 938 hPa • Maximum Surface Wind Speed • Lili’02 125 kt • Isidore’02 110 kt
Tropical Cyclone Pressure Wind Relationship • Pressure : Wind = MSLP : Vmax • MSLP = minimum sea-level pressure • Vmax = maximum surface wind (10-m, 1-min wind)
P-Wind-Deviation (MSLP Vmax) • Definition: Difference between observed MSLP and observed maximum wind speed converted to MSLP with a Pressure-Wind Relationship…. • P-Wind Dev. = MSLPmin – MSLPDvorak, f (Vmaxmax)
01-E 01-I 98-G 99-B 99-L 02-L 01-M 96-F 95-M 95-F 02-I 95-O
Lili’02 Isidore’02
Erin’01 Lili’02 Isidore’02 Opal
Lili’02 Isidore’02
Lili Isidore
Tropical Cyclone Surface Wind Analysis -- based entirely on satellite data (along with center location and storm motion) --with sufficient resolution to depict intensity (maximum wind and its location) -- with sufficient coverage to depict size (area with winds exceeding gale force). -- frequent time intervals
Independent Surface Wind Analyses from Four Components • IR -Inner core, time continuity, rapid changes • AMSU -Inner and outer winds • Scatterometer -Outer winds, weak TCs • Satellite Winds -Outer winds, weak TCs
“Satellite only”Tropical Cyclone Surface Wind Analysis • COMBINATION OF FOUR ANALYSES • IR -Inner core, time continuity, rapid changes • AMSU -Inner and outer winds • Scatterometer -Outer winds, weak TCs • Satellite Winds -Outer winds, weak TCs • Global coverage • Time continuity • Consistent analysis