Download
1 / 22
240 likes | 394 Views
Constraint management. Constraint. Something that limits the performance of a process or system in achieving its goals. Categories: Market (demand side) Resources (supply side) Labour Equipment Space Material and energy Financial Supplier Competency and knowledge

E N D
Constraint • Something that limits the performance of a process or system in achieving its goals. • Categories: • Market (demand side) • Resources (supply side) • Labour • Equipment • Space • Material and energy • Financial • Supplier • Competency and knowledge • Policy and legal environment
Steps of managing constraints • Identify (the most pressing ones) • Maximizing the benefit, given the constraints (programming) • Analyzing the other portions of the process (if they supportive or not) • Explore and evaluate how to overcome the constraints (long term, strategic solution) • Repeat the process
Linear programming… • …is a quantitative management tool to obtain optimal solutions to problems that involve restrictions and limitations (called constrained optimization problems). • …consists of a sequence of steps that lead to an optimal solution to linear-constrained problems, if an optimum exists.
Typical areas of problems • Determining optimal schedules • Establishing locations • Identifying optimal worker-job assignments • Determining optimal diet plans • Identifying optimal mix of products in a factory (!!!) • etc.
Linear programming models • …are mathematical representations of constrained optimization problems. • BASIC CHARACTERISTICS: • Components • Assumptions
Components of the structure of a linear programming model • Objective function: a mathematical expression of the goal • e. g. maximization of profits • Decision variables: choices available in terms of amounts (quantities) • Constraints: limitations restricting the available alternatives; define the set of feasible combinations of decision variables (feasible solutions space). • Greater than or equal to • Less than or equal to • Equal to • Parameters. Fixed values in the model
Assumptions of the linear programming model • Linearity: the impact of decision variables is linear in constraints and the objective functions • Divisibility: noninteger values are acceptable • Certainty: values of parameters are known and constant • Nonnegativity: negative values of decision variables are not accepted
Model formulation • The procesess of assembling information about a problem into a model. • This way the problem became solved mathematically. • Identifying decision variables (e.g. quantity of a product) • Identifying constraints • Solve the problem.
2. Identify constraints • Suppose that we have 250 labor hours in a week. Producing time of different product is the following: X1:2 hs, X2:4hs, X3:8 hs • The ratio of X1 must be at least 3 to 2. • X1 cannot be more than 20% of the mix. Suppose that the mix consist of a variables x1, x2 and x3
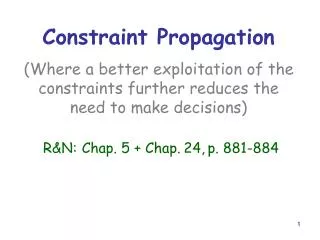
Graphical linear programming • Set up the objective function and the constraints into mathematical format. • Plot the constraints. • Identify the feasible solution space. • Plot the objective function. • Determine the optimum solution. • Sliding the line of the objective function away from the origin to the farthes/closest point of the feasible solution space. • Enumeration approach.
Corporate system-matrix 1.) Resource-product matrix Describes theconnections between the company’s resources and products as linear and deterministic relations via coefficients of resource utilization and resource capacities. 2.) Environmental matrix (or market-matrix): Describes the minimum that we must, and maximum that we can sell on the market from each product. It also describes the conditions.
Contribution margin • Unit Price - Variable Costs Per Unit = Contribution Margin Per Unit • Contribution Margin Per Unit x Units Sold = Product’s Contribution to Profit • Contributions to Profit From All Products – Firm’s Fixed Costs = Total Firm Profit
Partially convertible relations Non-convertible relations Resource-Product Relation types
Product-mix in a pottery – corporate system matrix e1: 1*P1+0,5*P2< 50 e2: 0,5*P1+1*P2< 50 e3: 0,1*P2< 10 m1, m2: 10 < P1< 100 m3, m4: 10 < P2< 100 ofCM: 200 P1+200P2=MAX 200 200
Objective function • refers to choosing the best element from some set of available alternatives. X*P1 + Y*P2 = max weights(depends on what we want to maximize: price, contribution margin) variables(amount of produced goods)
Solution with linear programming 33 jugs and 33 plaits a per week Contribution margin: 13 200 HUF / week T1 e1 100 ofF e3 e1: 1*P1+0,5*P2< 50 e2: 0,5*P1+1*P2< 50 e3: 0,1*P2< 10 m1,m2: 10 < P1< 100 m3, m4: 10 < P2< 100 ofCM: 200 P1+200P2=MAX 33,3 e2 100 T2 33,3
What is the product-mix, that maximizes the revenues and the contributionto profit!
P1&P2: linear programming r1: 2*T5 + 3*T6≤ 6000 r2: 2*T5 + 2*T6 ≤ 5000 m1, m2: 50 ≤ T5≤ 1500 p3, m4: 100 ≤ T6≤ 2000 ofTR: 50*T5 + 150*T6 = max ofCM: 30*T5 + 20*T6 = max
T1 r1 Contr. max: P5=1500, P6=1000 Rev. max: P5=50, P6=1966 3000 r2 2500 ofCM 2000 2500 ofTR T2