Download
1 / 26
260 likes | 266 Views
Dust modelling in HiGAM Presentation for HiGEM meeting, Reading 22 July 2008. Margaret Woodage Environmental Systems Science Centre University of Reading, U.K. Talk Outline. Progress of HiGAM dust papers Poster for Dust workshop in Leipzig, 15-17 Sept New work with HiGAM.

E N D
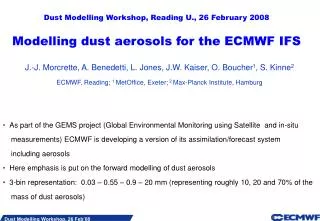
Dust modelling in HiGAM Presentation for HiGEM meeting, Reading22 July 2008 Margaret Woodage Environmental Systems Science Centre University of Reading, U.K.
Talk Outline • Progress of HiGAM dust papers • Poster for Dust workshop in Leipzig, 15-17 Sept • New work with HiGAM
Dust Paper 1 Title: UK-HiGEM: Simulations of desert dust and biomass burning aerosols with a high-resolution atmospheric GCM Authors: M. J. Woodage, A. Slingo, S. Woodward, R. E. Comer Contents:Basic model description and experiment design, dust tuning Results: i) Global and seasonal mean dust loadings ii) Radiative forcing due to dust iii) Validation against surface dust observations iv) Focus on African dust and biomass distributions and AODs v) African dust storm ‘case studies’ for February and July vi) Evaluation over Africa using GERB and AMMA data
Dust Paper 1 Done: Draft circulated to co-authors and (very positive) comments and suggestions received To Do: Add ‘stronger marketing’ comments (mainly to summary/ discussion) focussing on achievements and lessons learnt Tidy up figures: probably too many and all in colour at present.
Dust Paper 2 Title: UK-HiGEM: Impact of dust aerosol radiative forcing in a high-resolution atmospheric GCM Authors: M. J. Woodage, A. Slingo, S. Woodward, K. I. Hodges Contents: Focus on differences between active and passive dust experiments Results: Examine feedbacks on: i) dust loadings ii) temperature structure iii) precipitation – African and Indian monsoons iv) Radiation budget v) African Easterly waves
Dust Paper 2 Done: Skeleton paper with most of figures and brief text To Do: Expand text, especially results and discussion Complete figures and statistics for Easterly wave work (Kevin currently doing this) Distribute draft to co-authors for comments
Poster for Dust Workshop • 3rd International Workshop on Mineral Dust, Leipzig 15-17 Sept. • Invited speakers and poster sessions, covering latest developments in dust measurements, modelling and remote sensing. • Show results in paper 1 and some from paper 2
UK-HiGEM: Simulations of desert dust with a high-resolution AGCM M. Woodage, ESSC, University of Reading, U.K. ABSTRACT:A global high-resolution AGCM (HiGAM) has been run with an embedded mineral dust aerosol scheme which can be either passive (with no feedback on the model evolution) or active (in which the direct radiative effect of the dust impacts on the model). The model is shown to produce realistic horizontal and vertical distributions of dust for each season when compared with available satellite and ground-based observations, and other models. It is also capable of resolving smaller-scale features such as dust storms emanating from the Bodele and Saharan regions of North Africa, and the winter-time Bodele low-level jet. The top-of-atmosphere annual mean radiative forcing of the dust is found to be globally quite small, but locally very large exceeding 20 W/m2 overthe Sahara. The impact of this on the dust production itself, and climatological features such as the West African monsoon and Easterly waves is investigated by comparing 18-year means from the active and passive dust experiments. MODEL DESCRIPTION: HiGEM is a higher resolution version (1.25 deg longitude x 0.83 deg latitude and 38 levels in the vertical) of the Hadley Centre HadGEM climate model, built and run by the HiGEM consortium (described fully in Shaffrey et al, submitted to J Clim 2008) . In this work the atmospheric component was run (HiGAM), forced by time-varying sea-surface temperatures taken from the AMIP-II dataset, with the addition of the interactive dust model described in Woodward (2001). The dust model has 6 particle size bins in the range 0.03-30 μm radius, and a soil parent ancillary file determines the fractions and relative masses of clay, silt and sand available at the surface. Dust is mobilised when the friction velocity at the surface exceeds a threshold value which is function of particle size and soil moisture, and the magnitude of the dust flux is a function of the cube of the friction and threshold velocities. Once lofted, dust aerosol is subject to advection (by a semi-Lagrangian scheme), mixing in the boundary layer and by convection, and dry and wet deposition. Direct radiative effects (scattering and absorption of solar and thermal radiation) are modelled assuming spherical particles with appropriate refractive indices for each size bin. References:L. Shaffrey, I. Stevens, W. Norton, M. Roberts, P.-L. Vidale, J. Harle, A. Jrrar, D. Stevens, M. Woodage, M.-E. Demory, J. Donners, D. Clarke, A. Clayton, J. Cole, S. Wilson, W. Connolley, T. Davies, A. Iwi, T. Johns, J. King, A. New, J.Slingo, A. Slingo, L. Steenman-Clark, G. Martin. 'UK-HiGEM: The new UK High resolution Global Environmental Model. Model description and basic evaluation’ Submitted to J. Clim 2008 Woodward S. ‘Modelling the atmospheric life cycle and radiative impact of mineral dust in theHadley Centre climate model’, JGR vol 106, no D16, 18155-18166, 2001 Fig 2. 20-year mean seasonal vertical cross-sections of zonal mean dust concentrations from xcdfr. Model level 10 is ~800mb, level 20 is ~350mb, level 30 is ~70mb. Note the higher elevation of dust in March-August in the Northern hemisphere Fig 1. 20-year seasonal mean dust loadings from xcdfr. North Africa is the strongest source throughout the year with significant contributions from Saudi-Arabia, China and North America from March-November, and from Australia, South America from September-February. Fig 3. Annual mean net radiative forcing at the surface (top panel), top-of-atmosphere(centre panel) diagnosed from passive dust expt xcdfg. Fig 5 (below) 20-year annual mean dust loadings (left) and zonal mean vertical concentrations (right) for the active dust expt xcdfr (top), and the active-passive dustdifferences xcdfr-xcdfg (bottom). ‘Active’ dust expts have annual mean dust burdens ~18% higher than those with passive dust, due mainly to the column warming effect of the dust over the Sahara during boreal summer which generates more intense heat lows with stronger winds, which loft more dust higher into the atmosphere. Note, however, that for Sept-Feb dust loadings are reduced in the active dust case, due to a combination of increased soil moisture (resulting from higher precipitation, see Fig 6), cooler surface temperatures and weaker surface winds. Case Studies: February and July Saharan dust storms: the model is capable of of producing dust storms with realistic time and space scales, generated by synoptic-scale events such as an area of high pressure drifting eastwards across Algeria (Feb case), and a developing heat low moving westwards over the Sahara (July case). Fig 8. 3-hourly time-series of surface (skin) temperature (red), 925mb and 10m wind (blue and cyan) and dust emissions (green) are shown in the left-hand panels below for locations in the western Sahara (upper panel) and the Bodele (lower panel). Note that dust emission is initiated when surface winds exceed ~7 m/s, causing a reduction in the amplitude of the diurnal cycle in temperature. Note also the phase difference between the 10m and 925mb wind (low-level jet) in the Bodele, observed in the BoDEX campaign. Fig 7. Model dust loadings (contours) and 925mb wind vectors for 12 UT3,5,7 Feb. Fig 11 (left)The outgoing longwave radiation (red), mean-sea-level pressure (black), cloud fraction (blue) and dust column loading (green) for locations in the western Sahara (upper panel) and the Bodele (lower panel). Note the drop in pressure coincident with the increase in dust loading and reduction in the amplitude of the olr at Zouerate on 27-28 July. Note also the negative correlation between the cloud fraction and olr in the Bodele. Fig 9 Model dust loadings (contours) and 925mb wind vectors for 12 UT25,27,29 July Fig 12. (right) Comparison of the amplitude of the mean July outgoing thermal radiation from GERBdata and from the modelwith and without dust. Note the improvement when dust radiative effects are included (from PhD work by R. Comer, ESSC) Fig 10 (below). Hovmuller time-longitude plots of meridional velocity V at 700mb and column dust loading, meaned between 15N-25N, for June-Sept from the model. Easterly waves are evident transporting dust across the Atlantic from the Sahara (on the right of each plot) to the Caribbean (on the left). Fig 6. (below) Annual mean differences in precipitation (left) and 1.5m temperature (right) for the active dust expt (xckqr) minus the passive expt (xckqg).
New work with HiGAM (1) • Try new dust parent soil ancillary file in dust expts (used by Sean Milton et al. in NWP and CAMM models). • Old file was 1x1deg (Wilson & Henderson Sellers), new file is 1x1km IGBP file
Ann mean dust load and AODNew dust anc Old dust anc
Ann mean dust load by size binfor new and old dust ancil files: TUNING needed!
New work with HiGAM (2) • Use satellite simulator code to evaluate model clouds (in collaboration with Hadley Centre and Met Dept)
NCEO Atmos Climate Theme Task 3.1.3a: Evaluation of high-resolution versions of the Hadley Centre climate model Aim: to implement cloud simulator code in HiGEM and future high-resolution models to compare model-simulated variables directly with new high-resolution data from satellites, radar and lidar . Deliverables: Improved representation and evaluation of clouds and aerosols in models Method: Use CICCS code (CFMIP/ISCCP/CloudSat/CALIPSO Simulator) which has been set up by various groups to run off-line from many different types models (GCMs to CRMs) to evaluate simulated clouds and assess cloud-climate feedbacks.
The CFMIP ISCCP/CloudSat/CALIPSO simulator (CICCS) To facilitate the exploitation of CloudSat, CALIPSO data in numerical models, we are developing a system that allows to simulate the signal that CloudSat/CALIPSO would see in a model-generated world. It is a flexible tool to simulate active instruments in models (climate, forecast, cloud-resolving). The ISCCP simulator will also be included in the package. There are several groups involved in the project: Met Office Hadley Centre, LMD/IPSL (Laboratoire de Météorologie Dynamique/Institut Pierre Simon Laplace) ,LLNL (Lawrence Livermore National Laboratory) , CSU (Colorado State University) , UW (University of Washington) The approach is to create a modular code in FORTRAN90 that can be plugged in different types of models, from GCMs to CRMs. There are 5 modules that do science: SCOPS: sub-grid cloud distribution. SG PRECIP: sub-grid precipitation. CLOUDSAT: radar simulator CALIPSO: lidar simulator STATISTICS: summary statistics diagnostics (from website at cfmip.metoffice.com/CICCS.html)
Progress with cloud simulator work • Although simulator code works off-line, it needs certain diagnostics which are not standard at vn6.1 (HiGEM) (e.g. convective and large-scale cloud amounts and mixing ratios on model levels) • Need extra modsets and STASH files (obtained from Met office) • ISCCP diagnostics do not work with PUM vn6.1 (although code appears to be there); BUT new ciccs release should contain off-line ISCCP simulator.
DIFFS in 850 mb storm density (upper) and strength (lower) xcdfr - xcdfg
DIFFS in 600mb storm density (upper) and strength (lower) xcdfr - xcdfg