Download
1 / 16
160 likes | 253 Views
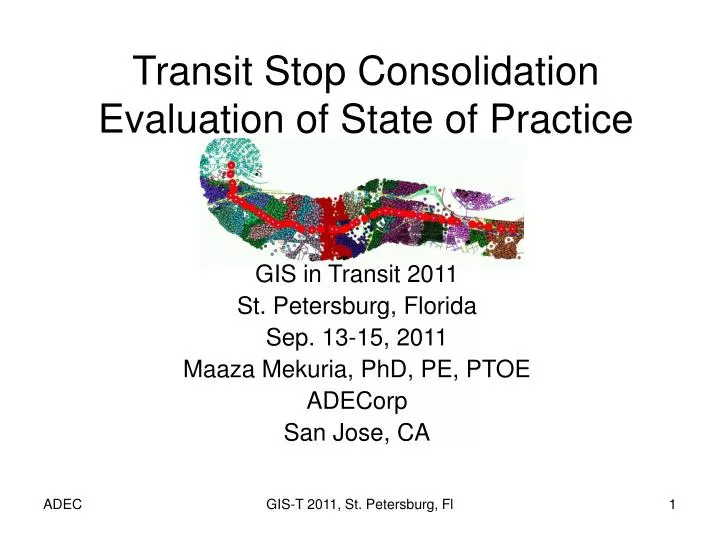
Transit Stop Consolidation Evaluation of State of Practice. GIS in Transit 2011 St. Petersburg, Florida Sep. 13-15, 2011 Maaza Mekuria, PhD, PE, PTOE ADECorp San Jose, CA. Modeling Paradigms. Continuous Pros

E N D
Transit Stop Consolidation Evaluation of State of Practice GIS in Transit 2011 St. Petersburg, Florida Sep. 13-15, 2011 Maaza Mekuria, PhD, PE, PTOE ADECorp San Jose, CA GIS-T 2011, St. Petersburg, Fl
Modeling Paradigms • Continuous • Pros • Useful for exploring relationships between variables (demand, spacing, volume) • Cons • Lacks sensitivity to • Location/safety • demand concentration • Access network geometry GIS-T 2011, St. Petersburg, Fl
Modeling Paradigms • Discrete • Pros (can be made to be sensitive to) • Physical location • Demand intensity • Access network geometry • Cons • Requires • More detailed data • Robust analytical tools • More time GIS-T 2011, St. Petersburg, Fl
Stop Spacing Impacts GIS-T 2011, St. Petersburg, Fl
Modeling Stop Spacing • Single/Bi-Directional Stops • Multiple Periods • Sensitivity to Various Input Parameters • Common Base for comparison • What if scenarios GIS-T 2011, St. Petersburg, Fl
State of the Practice • Rule of Thumb based on • Demand at a stop • Proximity to the nearest stop • Other policy considerations GIS-T 2011, St. Petersburg, Fl
Stop Spacing Optimization • Geographic modeling • Walk impact using real street network • Demand density using parcel attributes • Stop enumeration • Multi-period analysis • Sensitivity analysis GIS-T 2011, St. Petersburg, Fl
Service Area Analysis using three data sets GIS-T 2011, St. Petersburg, Fl
DP Immediate Cost Computation • To find costs at j, need to specify at least 1 or more predecessor successor stops • >=1-dimensional search space GIS-T 2011, St. Petersburg, Fl
Quintuplet DP Algorithm walk(k; i,j,l,m) - sum of walking cost impacts associated with stop k over all periods ride(k; i,j,l,m) - sum of riding cost impacts associated with stop k over all periods Oper(k; i,j,l,m) - sum of operating cost impacts associated with stop k over all periods f(l; j,k,m) – optimal return function cost impacts associated with stop l to the end. GIS-T 2011, St. Petersburg, Fl
Study Area I Transit Details • Route 57 Crosstown Bus • Kenmore to Watertown 45 Inbound and 43 Outbound existing stops • Peak ridership • AM East Bound to Kenmore • PM peak Westbound to Watertown GIS-T 2011, St. Petersburg, Fl
Study Area II Transit Details • Route 1 Crosstown Bus 35 SB, 36 NB existing stops • Peak ridership • Balanced in both directions GIS-T 2011, St. Petersburg, Fl
Rt 57 Cross-town Bus DP Result Comparison Vs Consultant Recommendation (Inbound dirn.) GIS-T 2011, St. Petersburg, Fl
Rt 1 Cross-town Bus DP Result Comparison Vs Consultant Recommendation GIS-T 2011, St. Petersburg, Fl
Summary State of the Practice can not capture all factors Use of standard data sets Appropriate tools with flexibility Analyst input Geographic Output GIS-T 2011, St. Petersburg, Fl
Questions? GIS-T 2011, St. Petersburg, Fl