Download
1 / 50
500 likes | 684 Views
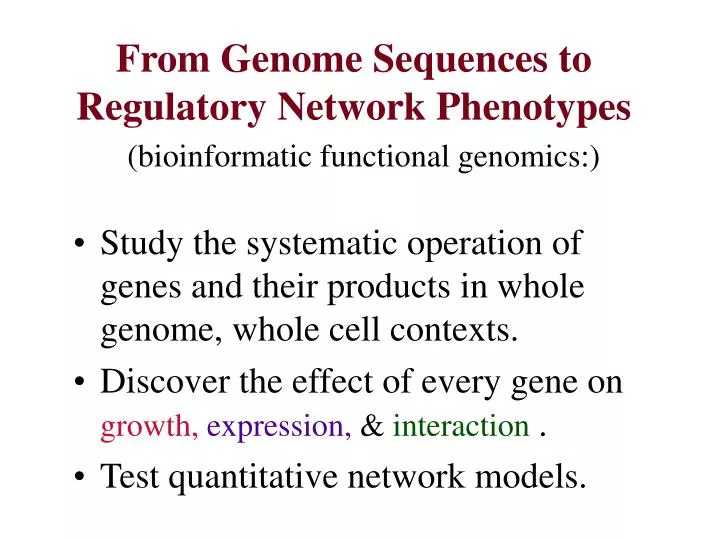
From Genome Sequences to Regulatory Network Phenotypes. (bioinformatic functional genomics:). Study the systematic operation of genes and their products in whole genome, whole cell contexts. Discover the effect of every gene on growth, expression, & interaction .

E N D
From Genome Sequences to Regulatory Network Phenotypes (bioinformatic functional genomics:) • Study the systematic operation of genes and their products in whole genome, whole cell contexts. • Discover the effect of every gene on growth, expression, & interaction . • Test quantitative network models.
Harvard Center for Computational Genetics John Aach Tim Chen George Church Jason Hughes Jason Johnson Abby McGuire Jong Park Fritz Roth Affymetrix David Lockhart Eric Gentalen Growth, Expression, & Interaction HMS Genetics Andy Link, Doug Selinger Pete Estep, Michael Ching Martha Bulyk, Sonali Bose Martin Steffen Saeed Tavazoie, Annie Chan Dereth Phillips, Chris Harbison NCBI Andrew Neuwald UCSD Bernhard Palsson DOE, DARPA, Lipper, NIST, HMR
Sequenced genomes FUNs Science 277: 1433 (1997)
Choice of Cells Small genome size: Mycoplasma, Haemophilus, Methanococcus Energy relevance:Methanobacterium, Synechocystis Major Pathogens:Mycobacterium, Escherichia, Helicobacter Biotech Production:Escherichia, Saccharomyces, Homo Recombinant protein production, in vivo combinatorial chemistry, BACs, gene delivery, etc. 15 going on 40 complete genomes. 30,000 going on 150,000 complete genes (& intergenic regions). Smith, et al. (1997) J. Bacteriol. 179:7135-55. Methanobacterium Blattner, et al. (1997) Science 277, 1453-74. Escherichia Goffeau, et al. (1996) Science 274, 563-7. Saccharomyces
Metabolic & regulatory databases 4288 / 4909 E. coli orfs / genes 587 - 804 enzymes 720 - 988 metabolic reactions 436 / 1303 metabolites / compounds Varma & Palsson (1994) Appl. Env. Micro. 60:3724. Karp et al. (1998) NAR 26:50. EcoCyc Selkov, et al. (1997) NAR 25:37. WIT Robison and Church http://arep.med.harvard.edu
BiomoleculeInteraction,Growth, Expression, & Database: BIGED John Aach Harvard Center for Computational Genetics
Functional Genomics: Growth, Expression, & Interaction Why? Sampled sequence vs. Completed genomes Random vs. Engineered mutations & environments Evolutionary models vs. High-throughput assays Pure comparative genomics challenge: 15% amino acid identity: Globins retain heme & oxygen binding functions 100% amino acid identity: Enolase functions vary from enzymatic to major vertebrate lens structural component.
Escherichia coli & Saccharomyces cerevisiae Regulatory and Metabolic Networks Expression DNA RNA Protein kR kP kI Environments kD Interactions Growth rate kc Metabolites kD, kD, kD : Initiate, Elongate, Terminate, Fold, Modify, Localize, Degrade
Translating successful strategies: Metrics (physics envy & killer applications) Automate Data Model Similarity quality quality search X-ray 1960 resolution |o-c|/o DALI diffraction < 0.2nm R < 0.2 Sequence 1988 discrepancy conserved BLAST bp <0.01% proteins Function 1999 completion DNAgibbs CorFun (growth, expression, & interaction; CorEnvironment)
Ratio of strains over environments, e , times, te, selection coefficients, se, R = Ro exp[-sete] 80% of 34 random yeast insertions have s<0.3% or s>0.3% t=160 generations, e=1 (rich media); ~50% for t=15, e=7. Should allow comparisons with population allele models. Other multiplex competitive growth experiments: Thatcher, et al. (1998) PNAS 95:253. Link AJ (1994) thesis; (1997) J Bacteriol 179:6228. Smith V, et al. (1995) PNAS 92:6479. Shoemaker D, et al. (1996) Nat Genet 14:450.
Multiplex: Tag(Mix) > Process > Decode Internal standards, identical conditions, microscale Multiplex DNA sequencing. Church GM. Kieffer-Higgins S. (1988) Science. 240:185. Physical mapping of complex genomes by cosmid multiplex analysis. Evans GA. Lewis KA. (1989) PNAS 86: 5030. Multiplexed biochemical assays with biological chips. Fodor SP, et al. (1993) Nature 364:555. Lashkari DA, et al. (1995) An automated multiplex oligonucleotide synthesizer. PNAS 92(17):7912.
107 Environments (so far) Combinatorial: a,H,F,Q,t g,L,Y,N,S C,I,W,u,E M,K,T,D,dap V,P,R,G,thiamine a,g,C,M,thiamine H,L,I,K,V F,Y,W,T,P Q,N,u,D,R t,S,E,dap,G minimal media yeast extract synthetic rich Low N Low P NaCl urine pancreatin Bile Cholate triton X-100 2 acetate 4 butyrate 6 hexanoate homoserine lactone pyridoxin,nicotinate,biotin,pantothenate,A pH: 5, 6, 7, 8, 9 Temperature:25, 30, 37, 45
Genome Engineering Challenges: Construct any mutant in any background, multiple mutants, minimizing hitchhiking mutants. Avoid undesired residual activities and neomorphic effects on adjacent genes in most deletion, insertion nonsense, or antisense alleles. Full in-frame replacements, computationally track gene overlaps, primer & genomic repeats. Link, et al. (1997) J. Bacteriol. 179: 6228-6237. (pKO3) http://arep.med.harvard.edu
Crossover PCR in-frame deletions / tag substitutions gene of interest nearby gene Primer with NotI site tag A T G A T G T A A T A A c-tag Primer with Bam site A T G T A A A T G tag T A A
tag tag
P r i m e r d e s i g n f o r s i z e - t a g g e d P C R 3% agarose universal tag primer Deleted Orf length size-tagged primers 789 ygfX 518 yiaU 348 yhcS 266 ydhB 194 yfiE 141 ygoX 106 pssR
Genome EngineeringCurrent status 5 Highly Expressed Genes Link 46 Putative regulatory FUNs Phillips 24 Highly conserved FUNs Loferer 20 Flux Balance Predictions in prep.
Flux balance model with max growth objective: S . v = b S = stoichiometric matrix (m x n) v = vector of n fluxes b = I/O rate vector n = 720 metabolic fluxes m= 436 metabolites Predict major flux changes: zwf- zwf- pnt- & synthetic lethals: zwf- pgi-
Non-coding regions: E. coli: 11% Yeast: 25% Human: 95% Similarity searching for environments, growth, expression, & interaction data and then the Challenges of DNA sequence motifs: short motifs & limited alphabet (4)
Positive correlation Negative correlation kdgT CorFun = Zg.ZgT /n n = #environ+genotypes g = gene sites (switching n & g gives CorEnv) F YidX E rspA mtlA3’ mtlA5’ D o184 ppiA Catabolite repression glucose & Crp regulated f105 C hrsA f214 carAB B Log vs. stationary- phase regulated YiaK o85 pspA A Yggn Yggn pspA YidX YiaK hrsA ppiA o184 rspA kdgT o85 f214 f105 mtlA3’ carAB mtlA5’ growth, expression, &/orinteraction
Expression data from four cultures,allow three comparisons glucose 30oC Mating type a galactose 30oC Mating type a glucose 30oC Mating type glucose 30o C -> 39o Cshock Mating type a
Expression Quantitation Options 1) n-dimensional cDNA or protein displays 2) Computer selected oligomer-arrays photolithographic or piezoelectric deposition 3) Gridded microarrays from clones 4) Counting 13-bp cDNA tags (SAGE) (20,000 tags means <800 RNAs have S/N>4) Lockhart, et al. (1997) Nature Biotechnology 15:1359. DeRisi, et al. (1997) Science 278:680. Velculescu, et al. (1997) Cell 88:243.
Galactose Regulatory Network GAL4 GAL80 Gal4p-Gal80p inactive complex Gal1p Gal3p GALACTOSE GAL3 Gal4p-Gal80p active complex ? PGM2 MEL1 GAL7 GCY1 GAL2 GAL10 GAL1 Structural Genes For Galactose Metabolism
Fold Change in GAL3 in Galactose vs. Glucose(Median Fold Change is 3.1)
To analyze the most induced genes, we... • Extracted the intergenic DNA sequence upstream of each translation start using the Saccharomyces Genome Database. • Used an algorithm for multiple sequence alignment to look for sequence motifs conserved among the most induced (or repressed). • Looked at the intersection of genes which both matched a conserved motif and were induced (or repressed)
Gibbs Motif Sampling Strategy • Initialize the alignment by choosing a random subset of all possible sites as the ‘site’ alignment, and use all remaining sequences to give a ‘non-site’ alignment. • Select a potential site from among all possible sites. • If the site is in the alignment, take it out. • Calculate the relative likelihood that the potential site belongs with the site alignment rather than the ‘non-site’ alignment, based on a Bayesian multinomial distribution model. • Randomly choose whether or not to add the site, weighted by this relative likelihood. • Repeat Step 2
‘DNAGibbs’: A Modified Gibbs Motif Sampler Optimized for DNA searches. • Either forward or reverse strand of a potential site -- but not both -- may be added to the alignment. • Near-optimum sampling method was improved so that it is faster and tends to result in higher scoring alignments. • Simultaneous multiple motif searching was replaced with a more efficient iterative masking approach. • The model for base frequencies of non-site sequence was fixed using the average nucleotide frequencies of S. cerevisiae. • Now runs on DEC Unix and Windows platforms, in addition to the formerly supported SGI and Sun Unix platforms.
Finally, exclude motifs with: • DNAGibbs (maximum log a posteriori likelihood ratio) scores less than 5. . • Good matches (Z < 3 sd below the mean of the aligned positive motifs) with greater than 10% of all yeast genes (ORFs) *O.G. Berg & P.H. von Hippel, J. Mol. Biol., 193: 723-750 (1987)
Using the top 10 genes induced in galactose, DNAGibbs found UASG, the site recognized by Gal4p Information (Bits) CGYTCGGA-GA-AGT---CCGA Previous UASG consensus sequence logos were developed by T.D. Schneider & R.M. Stephens, Nucleic Acids Res., 18: 6097-6100 (1990).
Genes that changed between galactose and glucose by more than 2-fold and have strong matches to the UASG motif Gene Fold Change Best Z-Score # of Sites GAL1 >65 -1.4 5 GAL7 >42 -0.7 2 GAL10 >38 -1.4 5 GCY1 >12 0.5 1 GAL2 >8 0.4 4 YPL066W >6 -1.1 1 YPL067C >6 -1.1 1 YMR318C 4 1.1 1 GAL3 >3 2 2
Galactose Regulatory Network GAL4 GAL80 Gal4p-Gal80p inactive complex Gal1p YPL067C YPL066W Gal3p GALACTOSE ? GAL3 YMR318C Gal4p-Gal80p active complex ? PGM2 MEL1 GAL7 GCY1 GAL2 GAL10 GAL1 Structural Genes For Galactose Metabolism
DNAGibbs and mating type Motif Score %ORF ConsensusSimilarity mt-1 (A) 8.9 0.11 ttcctarttng P Box mta-1 (B) 8.5 0.05 anwncwnkmaananantcwtbwtnw - mta-2 (C) 5.0 0.10 aaaycawmawnanwa - mta-3 (D) 28.1 0.31 grnawktacayg 2-bind, mt-mta-1 mt-mta-1 (E) 20.7 0.34 crtgtanntwyc 2-bind mta-3 mt-mta-2 (F) 5.3 0.13 kwtnywnnnknnntgtttsa PRE, mt-mta-2 mt-mta-3 (G) 8.6 0.27 tgamaywwtnaama PRE, mt-mta-1 mt-mta-4 (H) 5.3 0.31 rmtgmcngcma Q Box Expect DNABP Consensus Ref:Herskowitz, et al., P Box Mcm1p tttcctaattaggnan in Gene Expression, E. W. Jones, Q Box Mat1p tcaatgacag et al., Eds. (CSHL Press, NY, 1992) . 2-bind Mat2p crtgtaawt vol. 2: pp. 583-656 PRE Ste12p tgaaaca
Calibration of 60 E. coli binding site matrices
Interaction Quantitation Options Over-expression: Yeast two-hybrid screens (in vivo complexity) In vitro chip assays Martha Bulyk, David Lockhart, Erik Gentalen Natural levels, environmental regulation: Subcellular fractionation (unstable) In vivo footprinting (partners unknown) In vivo crosslinking
3' C g G c g C c G 5' Combinatorial ds-DNA Chips(chemical, photo & enzymatic synthesis) 5' A C A C A C A A C C G G h spacer n-mer Polymerase mask 2 x x x x A C A C A C A A C C G G A A o o o o specific 16-mer primer 3' 3' SiO2
Interaction Quantitation Options Over-expression: Yeast two-hybrid screens (in vivo complexity) In vitro chip assays Natural levels, environmental regulation: Subcellular fractionation (unstable) In vivo footprinting (partners unknown) In vivo crosslinking Martin Steffen, Andy Link
Isolate in vivo crosslinked complexes by nucleic acid CsCl (or hybridization) by protein epitope tag analyze protein by DNase 2D gel, trypsin-LC-ESI-MS/MS analyze DNA/RNA by chip pH kdal Link et al. (1997) Electrophoresis 18:1259 & 1314
Rich media log-phase, in vivo crosslink, DNaseI digest pH 4 5 6 7 100 50 40 30 kdal g r p E l a c I s s p A 20 e f p p u r E s s b d p s d p s f u r 10 h n s i h f B
In vivo crosslinking & footprinting summary 11% of the E.coli genome is non-coding. About 340 / 4328 proteins are likely DNA-binding proteins (2 or the top 380 proteins). 24/25 footprinted GATC sites are non-coding. Odds = 10-27. 2/3 crosslinked DNA molecules are likely regulatory binding sites. Odds = 0.04 8/11 top DNA-crosslinked proteins are known DNA-binding proteins. Odds = 10-16.
Thoughts on chips for crosslinked epitope selections (& generally). An easy 10-fold enrichment but with 40,000 fragments means an expensive 1:4000 Signal:Noise, if sequencing (or SAGE) were used. However, spread over a chip, 1:10.
E. coli oligonucleotide chip challenges: #1) Closely spaced transcripts, e.g. carAB: (Intergenic 25-mers overlap, start 6 bp apart on average) P1(pyrimidine) ... 48 bp ... P2(arginine) gggtaagcaaatttgcattgcttcatactgactgaatgaattaatatgcaaataaagtg #2) Repeats, e.g. tufA & tufB DNA. Mismatches: * .....*.........*..*....................................................................... .......................................................................................... .......................................................................................... .......................................................................................... .......................................................................................... .......................................................................................... ................................................*......................................... .......................................................................................... .......................................................................................... ....................................................................................*..... .......................................................................................... ............................................................*............................. ......*.................*..*........*.......................*............................. *.............
From Genome Sequences to Regulatory Network PhenotypesSummary Expression: Cell-type & condition clustering plus DNAGibbs algorithm extracts intergenic binding motifs for yeast Gal-Glc, Mat-Mata, & 30oC-39oC comparisons. Interaction: Strong enrichment for low abundance wild-type & mutant in vivo E.coli DNA-protein contacts establishes mechanistically anchored intergenic elements. Growth:Multiplex competitive growth of in-frame replacements for novel E.coli regulatory genes defines cellular system integration & environments.
Escherichia coli & Saccharomyces cerevisiae Regulatory and Metabolic Networks Population Selection,Flux Balance,&Gibbs Expression DNA RNA Protein kR kP kI Environments kD Interactions Growth rate kc Metabolites kD, kD, kD : Initiate, Elongate, Terminate, Fold, Modify, Localize, Degrade
Harvard Center for Computational Genetics John Aach Tim Chen George Church Jason Hughes Jason Johnson Abby McGuire Jong Park Fritz Roth Affymetrix David Lockhart Eric Gentalen Growth, Expression, & Interaction HMS Genetics Andy Link, Doug Selinger Pete Estep, Michael Ching Martha Bulyk, Sonali Bose Martin Steffen Saeed Tavazoie, Annie Chan Dereth Phillips, Chris Harbison NCBI Andrew Neuwald UCSD Bernhard Palsson DOE, DARPA, Lipper, NIST, HMR