Download
1 / 1
10 likes | 98 Views
Generation of intense few-cycle pulses from the visible to the mid-IR Josh Nelson 1 Danny Todd 2 Adam Summers 3 Derrek Wilson 3 Dr. Carlos Trallero 3

E N D
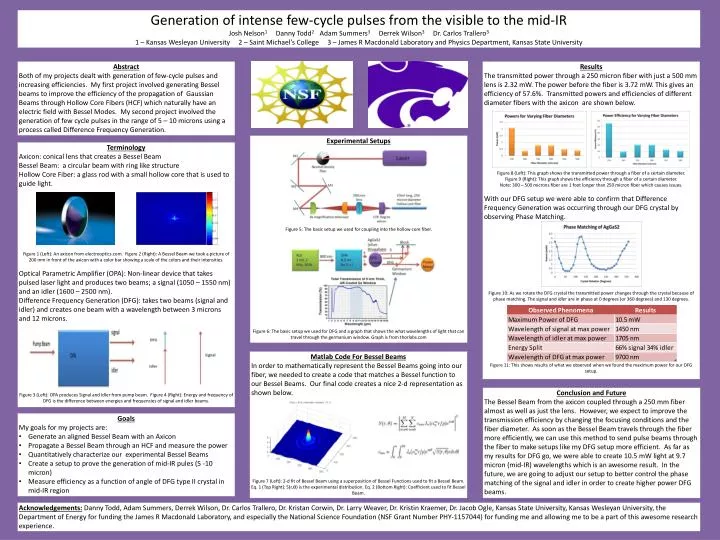
Generation of intense few-cycle pulses from the visible to the mid-IR Josh Nelson1 Danny Todd2 Adam Summers3 Derrek Wilson3 Dr. Carlos Trallero3 1 – Kansas Wesleyan University 2 – Saint Michael’s College 3 – James R Macdonald Laboratory and Physics Department, Kansas State University Abstract Both of my projects dealt with generation of few-cycle pulses and increasing efficiencies. My first project involved generating Bessel beams to improve the efficiency of the propagation of Gaussian Beams through Hollow Core Fibers (HCF) which naturally have an electric field with Bessel Modes. My second project involved the generation of few cycle pulses in the range of 5 – 10 microns using a process called Difference Frequency Generation. Results The transmitted power through a 250 micron fiber with just a 500 mm lens is 2.32 mW. The power before the fiber is 3.72 mW. This gives an efficiency of 57.6%. Transmitted powers and efficiencies of different diameter fibers with the axicon are shown below. Figure 8 (Left): This graph shows the transmitted power through a fiber of a certain diameter. Figure 9 (Right): This graph shows the efficiency through a fiber of a certain diameter. Note: 300 – 500 microns fiber are 1 foot longer than 250 micron fiber which causes issues. With our DFG setup we were able to confirm that Difference Frequency Generation was occurring through our DFG crystal by observing Phase Matching. Figure 10: As we rotate the DFG crystal the transmitted power changes through the crystal because of phase matching. The signal and idler are in phase at 0 degrees (or 360 degrees) and 130 degrees. Figure 11: This shows results of what we observed when we found the maximum power for our DFG setup. Experimental Setups Figure 5: The basic setup we used for coupling into the hollow core fiber. Figure 6: The basic setup we used for DFG and a graph that shows the what wavelengths of light that can travel through the germanium window. Graph is from thorlabs.com Terminology Axicon: conical lens that creates a Bessel Beam Bessel Beam: a circular beam with ring like structure Hollow Core Fiber: a glass rod with a small hollow core that is used to guide light. Figure 1 (Left): An axicon from electrooptics.com. Figure 2 (Right): A Bessel Beam we took a picture of 200 mm in front of the axicon with a color bar showing a scale of the colors and their intensities. Optical Parametric Amplifier (OPA): Non-linear device that takes pulsed laser light and produces two beams; a signal (1050 – 1550 nm) and an idler (1600 – 2500 nm). Difference Frequency Generation (DFG): takes two beams (signal and idler) and creates one beam with a wavelength between 3 microns and 12 microns. Figure 3 (Left): OPA produces Signal and Idler from pump beam. Figure 4 (Right): Energy and frequency of DFG is the difference between energies and frequencies of signal and idler beams. Matlab Code For Bessel Beams In order to mathematically represent the Bessel Beams going into our fiber, we needed to create a code that matches a Bessel function to our Bessel Beams. Our final code creates a nice 2-d representation as shown below. Figure 7(Left): 2-d fit of Bessel Beam using a superposition of Bessel Functions used to fit a Bessel Beam. Eq. 1 (Top Right): S(r,ϴ) is the experimental distribution. Eq. 2 (Bottom Right): Coefficient used to fit Bessel Beam. Conclusion and Future The Bessel Beam from the axicon coupled through a 250 mm fiber almost as well as just the lens. However, we expect to improve the transmission efficiency by changing the focusing conditions and the fiber diameter. As soon as the Bessel Beam travels through the fiber more efficiently, we can use this method to send pulse beams through the fiber to make setups like my DFG setup more efficient. As far as my results for DFG go, we were able to create 10.5 mW light at 9.7 micron (mid-IR) wavelengths which is an awesome result. In the future, we are going to adjust our setup to better control the phase matching of the signal and idler in order to create higher power DFG beams. • Goals • My goals for my projects are: • Generate an aligned Bessel Beam with an Axicon • Propagate a Bessel Beam through an HCF and measure the power • Quantitatively characterize our experimental Bessel Beams • Create a setup to prove the generation of mid-IR pules (5 -10 micron) • Measure efficiency as a function of angle of DFG type II crystal in mid-IR region Acknowledgements: Danny Todd, Adam Summers, Derrek Wilson, Dr. Carlos Trallero, Dr. Kristan Corwin, Dr. Larry Weaver, Dr. Kristin Kraemer, Dr. Jacob Ogle, Kansas State University, Kansas Wesleyan University, the Department of Energy for funding the James R Macdonald Laboratory, and especially the National Science Foundation (NSF Grant Number PHY-1157044) for funding me and allowing me to be a part of this awesome research experience.