Download
1 / 1

E N D
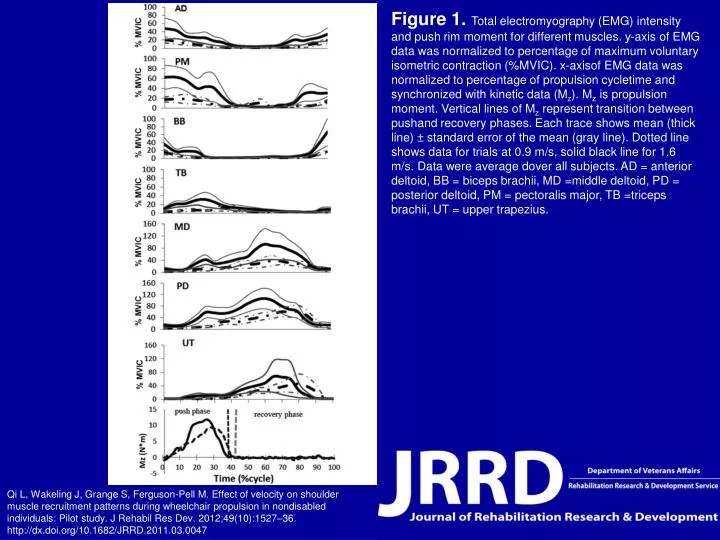
Figure 1. Total electromyography (EMG) intensity and push rim moment for different muscles. y-axis of EMG data was normalized to percentage of maximum voluntary isometric contraction (%MVIC). x-axisof EMG data was normalized to percentage of propulsion cycletime and synchronized with kinetic data (Mz). Mz is propulsion moment. Vertical lines of Mz represent transition between pushand recovery phases. Each trace shows mean (thick line) ± standard error of the mean (gray line). Dotted line shows data for trials at 0.9 m/s, solid black line for 1.6 m/s. Data were average dover all subjects. AD = anterior deltoid, BB = biceps brachii, MD =middle deltoid, PD = posterior deltoid, PM = pectoralis major, TB =triceps brachii, UT = upper trapezius. Qi L, Wakeling J, Grange S, Ferguson-Pell M. Effect of velocity on shoulder muscle recruitment patterns during wheelchair propulsion in nondisabled individuals: Pilot study. J Rehabil Res Dev. 2012;49(10):1527–36.http://dx.doi.org/10.1682/JRRD.2011.03.0047