Download
1 / 14
140 likes | 337 Views
Digital Dashboards for Los Angeles County Departments, Commissions and Agencies. Digital Dashboards are Prompted by Countywide Performance Counts. County of Los Angeles, under the leadership of the CEO, is committed to Performance Counts. Digital Dashboards Show Performance. Demo of website:

E N D
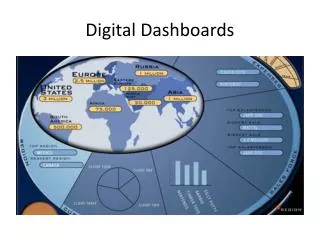
Digital Dashboardsfor Los Angeles County Departments, Commissions and Agencies
Digital Dashboards are Prompted by Countywide Performance Counts • County of Los Angeles, under the leadership of the CEO, is committed to Performance Counts. • Digital Dashboards Show Performance. • Demo of website: • http://lacounty.info/performance_counts
Performance Counts! • Known by many names -- performance measures, performance metrics, or key performance indicators -- they exist to measure progress! • To display these on a Digital Dashboard, give me: • A Metric • A Target • and An Actual Measurement • Performance Counts has created a need for County Dashboards in all County Departments. • ISD/IDD created a Dashboard Template that can be customized for all County Departments.
Conceptual “Views” of Metric Hierarchy Organization within Department • By Organization? • By Program? • Imagine a metric within your area of expertise. Time in Fiscal Years, Quarters, Months, or ? Programs • Wouldn’t it be nice to view that metric, along with it’s status over time? 1. Metric, 2. Target, and 3. Actual Value
Additional Information is Locatedon the Countywide BI Website • County of Los Angeles, under the leadership of the CIO, is committed to Business Intelligence. • County selected the Cognos Toolsuite. • Demo of website: • http://cbi.lacounty.gov
Demo Dashboard Demos: 1) ISD Digital Dashboard, 2) ISD Ad Hoc Database, and 3) BASIS PowerCubes
Dashboard / Application Development Process • *Initiate a Project and Define Scope/Deliverables • *Analyze the Existing Situation • *Define New System Requirements • *Design Logical System with Options • Design Physical System of Selected Option • Construct Programs and Database • Automate ETL Processes to Move/Load Data • *Testing - the automated system, User Acceptance • *End User Training * Partnership – Customer Participation and Approval
Generic Dashboard Development Timeline • Generic Estimates: • 2-4 Months to deliver Digital Dashboard Application and Training to End Users, • Depends on SME knowledge and involvement. • $38k - $77k, depending on needed ISD labor hours. • Other Costs to Consider: • Monthly BI Support. • User Licenses. • Database Hosting if necessary.
Next Steps • What would Your Management like to accomplish this fiscal year? • What would you like to do next? Future Possibilities are Unlimited!