Download
1 / 12
120 likes | 376 Views
Monthly mean of stream lines at 200 hPa (upper) and 850 hPa (lower). Tracks of the tropical cyclones formed in the month, if any, are superimposed on them. Blue numbers show identifications of tropical cyclones.

E N D
Monthly mean of stream lines at 200 hPa (upper) and 850 hPa (lower). Tracks of the tropical cyclones formed in the month, if any, are superimposed on them. Blue numbers show identifications of tropical cyclones. Areas of outgoing longwave radiation lower than 230w/m2 are shaded on the 850 hPa chart.
Monthly mean of stream lines at 200 hPa (upper) and 850 hPa (lower). Tracks of the tropical cyclones formed in the month, if any, are superimposed on them. Blue numbers show identifications of tropical cyclones. Areas of outgoing longwave radiation lower than 230w/m2 are shaded on the 850 hPa chart.
Monthly mean of stream lines at 200 hPa (upper) and 850 hPa (lower). Tracks of the tropical cyclones formed in the month, if any, are superimposed on them. Blue numbers show identifications of tropical cyclones. Areas of outgoing longwave radiation lower than 230w/m2 are shaded on the 850 hPa chart.
Monthly mean of stream lines at 200 hPa (upper) and 850 hPa (lower). Tracks of the tropical cyclones formed in the month, if any, are superimposed on them. Blue numbers show identifications of tropical cyclones. Areas of outgoing longwave radiation lower than 230w/m2 are shaded on the 850 hPa chart.
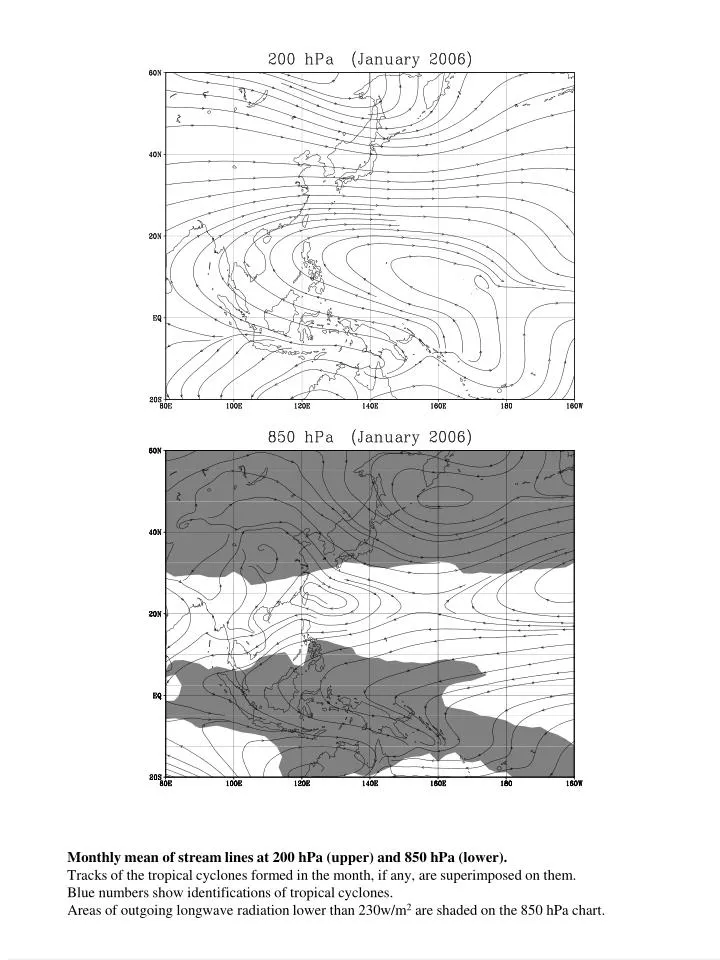
0601 0601 Monthly mean of stream lines at 200 hPa (upper) and 850 hPa (lower). Tracks of the tropical cyclones formed in the month, if any, are superimposed on them. Blue numbers show identifications of tropical cyclones. Areas of outgoing longwave radiation lower than 230w/m2 are shaded on the 850 hPa chart.
0603 0602 0603 0602 Monthly mean of stream lines at 200 hPa (upper) and 850 hPa (lower). Tracks of the tropical cyclones formed in the month, if any, are superimposed on them. Blue numbers show identifications of tropical cyclones. Areas of outgoing longwave radiation lower than 230w/m2 are shaded on the 850 hPa chart.
0604 0605 0604 0605 Monthly mean of stream lines at 200 hPa (upper) and 850 hPa (lower). Tracks of the tropical cyclones formed in the month, if any, are superimposed on them. Blue numbers show identifications of tropical cyclones. Areas of outgoing longwave radiation lower than 230w/m2 are shaded on the 850 hPa chart.
0607 0608 0610 0612 0609 0611 0606 0607 0608 0610 0612 0609 0611 0606 Monthly mean of stream lines at 200 hPa (upper) and 850 hPa (lower). Tracks of the tropical cyclones formed in the month, if any, are superimposed on them. Blue numbers show identifications of tropical cyclones. Areas of outgoing longwave radiation lower than 230w/m2 are shaded on the 850 hPa chart.
0614 0613 0615 0614 0613 0615 Monthly mean of stream lines at 200 hPa (upper) and 850 hPa (lower). Tracks of the tropical cyclones formed in the month, if any, are superimposed on them. Blue numbers show identifications of tropical cyclones. Areas of outgoing longwave radiation lower than 230w/m2 are shaded on the 850 hPa chart.
0618 0617 0616 0619 0618 0617 0616 0619 Monthly mean of stream lines at 200 hPa (upper) and 850 hPa (lower). Tracks of the tropical cyclones formed in the month, if any, are superimposed on them. Blue numbers show identifications of tropical cyclones. Areas of outgoing longwave radiation lower than 230w/m2 are shaded on the 850 hPa chart.
0620 0621 0620 0621 Monthly mean of stream lines at 200 hPa (upper) and 850 hPa (lower). Tracks of the tropical cyclones formed in the month, if any, are superimposed on them. Blue numbers show identifications of tropical cyclones. Areas of outgoing longwave radiation lower than 230w/m2 are shaded on the 850 hPa chart.
0723 0722 0723 0722 Monthly mean of stream lines at 200 hPa (upper) and 850 hPa (lower). Tracks of the tropical cyclones formed in the month, if any, are superimposed on them. Blue numbers show identifications of tropical cyclones. Areas of outgoing longwave radiation lower than 230w/m2 are shaded on the 850 hPa chart.