Download

1 / 79
810 likes | 1.09k Views
Dave McKenney. Data Aggregation In Wireless Sensor Networks. Presentation Outline. Introduction Algorithms/Approaches Tiny Aggregation (TAG) Synopsis Diffusion (SD) Tributaries and Deltas (TD) OPAG Exact Top-K (EXTOK) Histogram Incremental Update (HIU) Distributed Data Cube Conclusion.

E N D
Dave McKenney Data Aggregation In Wireless Sensor Networks
Presentation Outline • Introduction • Algorithms/Approaches • Tiny Aggregation (TAG) • Synopsis Diffusion (SD) • Tributaries and Deltas (TD) • OPAG • Exact Top-K (EXTOK) • Histogram Incremental Update (HIU) • Distributed Data Cube • Conclusion
Introduction • What is data aggregation? • Why is it important?
Aggregation Concerns • Energy vs. Latency vs. Accuracy
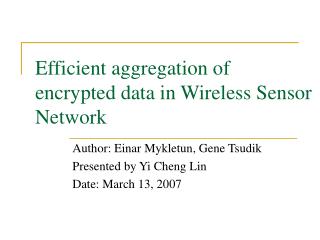
Tiny Aggregation (TAG)1 • Maintain tree structure • Aggregate at internal nodes [1] S. Madden, M. J. Franklin, J. M. Hellerstein, and W. Hong, “Tag: a tiny aggregation service for ad-hoc sensor networks,” ACM SIGOPS Operating Systems Review, vol. 36, no. SI, pp. 131–146, 2002.
Max – No Aggregation Total Messages: 0 5 7 4 8 3 1 9
Max – No Aggregation Total Messages: 1 5 Numbers: [5] Max Max 7 4 8 3 1 9
Max – No Aggregation Total Messages: 5 5 Numbers: [5,7,4] 4 7 7 4 Max Max Max Max 8 3 1 9
Max – No Aggregation Total Messages: 9 5 Numbers: [5,7,4,8,9] 8 9 7 4 8 9 8 3 1 9
Max – No Aggregation Total Messages: 13 5 Numbers: [5,7,4,8,9,3,1] Max: 9 3 1 7 4 3 1 8 3 1 9
Max – With TAG Total Messages: 0 5 7 4 8 3 1 9
Max – With TAG Total Messages: 1 5 Max Max 7 4 8 3 1 9
Max – With TAG Total Messages: 3 5 7 4 Max Max Max Max 8 3 1 9
Max – With TAG Total Messages: 7 5 7 4 [7,8,3] [4,1,9] 8 3 1 9 8 3 1 9
Max – With TAG Total Messages: 9 5 8 9 7 4 [7,8,3] [4,1,9] 8 3 1 9
Max – With TAG Total Messages: 9 (vs. 13) 5 [5,8,9] Max: 9 7 4 8 3 1 9
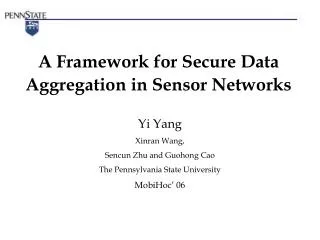
Synopsis Diffusion (SD)2 • Multipath routing • How to handle duplicate information • Order and Duplicate Insensitive (ODI) Aggregation • Example: Count - Flajolet and Martin [3] • Introduces approximation error [2] S. Nath, P. B. Gibbons, S. Seshan, and Z. R. Anderson, “Synopsis diffusion for robust aggregation in sensor networks,” in Proceedings of the 2nd international conference on Embedded networked sensor systems, 2004, pp. 250–262. [3] P. Flajolet and G. Nigel Martin, “Probabilistic counting algorithms for data base applications,” Journal of Computer and System Sciences, vol. 31, no. 2, pp. 182–209, 1985.
SD Structure/Routing Ring 1 Ring 3 Ring 2
SD Structure/Routing Ring 1 Ring 3 Ring 2
SD Structure/Routing Ring 1 Ring 3 Ring 2
SD Structure/Routing Ring 1 Ring 3 Ring 2
Tributaries & Deltas (TD)4 • Combine TAG and SD approaches M-Node T-Node [4] A. Manjhi, S. Nath, and P. B. Gibbons, “Tributaries and deltas: efficient and robust aggregation in sensor network streams,” in Proceedings of the 2005 ACM SIGMOD international conference on Management of data, 2005, pp. 287–298.
TD-Coarse vs. TD • Nodes change based on percent contributing • Expand when % < threshold, decrease if % > threshold • TD-Coarse • Expand: Switch all possible T nodes to M nodes • Decrease: Switch all possible M nodes to T nodes • TD • Expand: Switch any T node below M node with percentage contributing < threshold • Decrease: Switch M nodes to T node if percent contributing > threshold
OPAG5 [5] Z. Chen and K. G. Shin, “OPAG: Opportunistic Data Aggregation in Wireless Sensor Networks,” in 2008 Real-Time Systems Symposium, 2008, pp. 345-354.
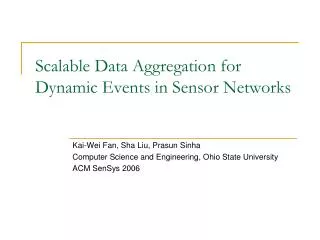
Exact Top-k6 • Find the top most k elements in the WSN • TAG • Full update every epoch • FILA • Uses filters approximations • Exact Top-k • Exact result • Partial updates [6] B. Malhotra, M. A. Nascimento, and I. Nikolaidis, “Exact top-k queries in wireless sensor networks,” IEEE Transactions on Knowledge and Data Engineering, vol. 23, no. 10, pp. 1513-1525, 2010.
Exact Top-k Example 5 Top-2 Top-2 7 4 8 3 1 9
Exact Top-k Example 5 7 4 [7] [4] Top-2 Top-2 Top-2 Top-2 8 3 1 9
Exact Top-k Example 5 7 4 [7,8,3] [4,1,9] 8 3 1 9 8 3 1 9
Exact Top-k Example Top-2: [8,9] α: 8 5 [5,7,8,4,9] 7,8 4,9 7 4 [7,8,3] [4,1,9] 8 3 1 9
Exact Top-k Example Top-2: [8,9] α: 8 5 TM-Node 8 8 F-Node 7 4 8 8 8 8 8 3 1 9
Exact Top-k Example Top-2: [8,9] α: 8 5 TM-Node F-Node 7 7 47 8 5 2 9 35 12
Exact Top-k Example Top-2: [9,10] α: 9 5 TM-Node 10 F-Node 7 10 710 8 5 2 9
Exact Top-k Example Top-2: [9,10] α: 9 5 TM-Node 9 9 F-Node 7 10 9 9 9 9 8 3 1 9
HIU Algorithm7 • TAG Histogram requires complete update • Histogram Incremental Update (HIU) • Sensors update if value leaves previous bin • Nodes store value and previous partial state • Update message – the change in bin count [0,1,2,2,1] [1,1,1,1,1] = [1,0,-1,-1,0] • Updates may negate each other [7] K. Ammar and M. A. Nascimento, “Histogram and other aggregate queries in wireless sensor networks,” in Proc. of SSDBM, 2011, pp. 1-12.
HIU Example 5 Bins: 0-1, 2-3, 4-5 4 2 [0,1,0] [0,1,0] [1,0,0] [1,0,0] 3 3 0 1 [1,0,0] [1,0,0] [0,1,0] [0,1,0]
HIU Example 5 Bins: 0-1, 2-3, 4-5 [0,0,1] + [0,1,0] [0,1,0] = [0,2,1] [1,0,0] + [1,0,0] [0,1,0] = [2,1,0] 4 2 [0,1,0] [0,1,0] [1,0,0] [1,0,0] 3 3 0 1 [1,0,0] [1,0,0] [0,1,0] [0,1,0]