Download
1 / 43
430 likes | 606 Views
The Solar Solution. Matt Martino Mark Bilodeau Senait Gebredingle Taylor Jones Adam Hipp Phil Losie. Agenda. Introduction Solar Roofs for SLO County Solar Plantation Energy Storage Mass transit Conclusion . Melting Pot Approach.

E N D
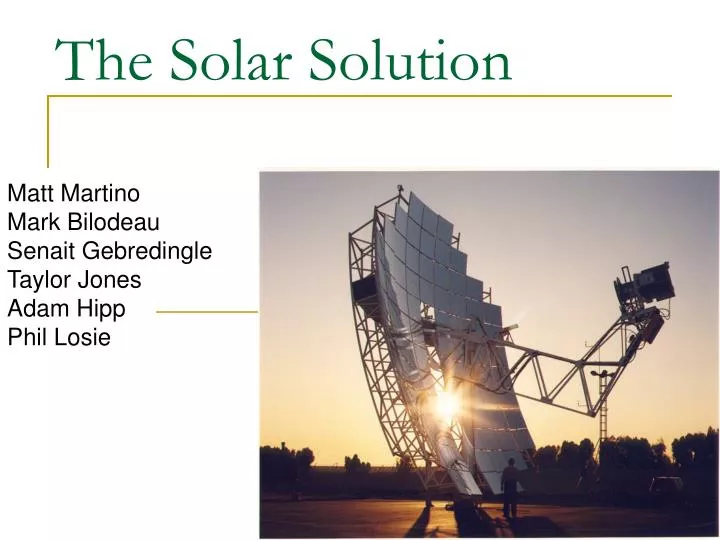
The Solar Solution Matt Martino Mark Bilodeau Senait Gebredingle Taylor Jones Adam Hipp Phil Losie
Agenda • Introduction • Solar Roofs for SLO County • Solar Plantation • Energy Storage • Mass transit • Conclusion
Melting Pot Approach Our approach is a plan for county wide sustainability! By leveraging existing infrastructure and expanding to current and future technologies we hope to create a comprehensive energy solution for San Luis Obispo County.
Agenda • Introduction • Solar Roof for SLO County • Solar Plantation • Energy Storage • Mass transit • Conclusion
Solar Roof for SLO County Advantages-Solar energy is free -It needs no fuel-produces no waste or pollution.-Excellent supplement to other renewable sources-Solar energy significantly dropped in price -According to CAR, more than 60% buyers (market for solar cell)DisadvantagesDoesn't work at nightVery expensive to buildLow conversion efficiency (improving)
1 Solar Roof 2 Solar panels convert sunlight instantly into DC electric power Inverter: converts DC power into standard household AC power for use in the home and synchronizes with utility power. Existing electrical panel: distributes solar electricity to load in the house 4. Utility Meter: spins backwards when solar power production exceeds house demand, selling power back to the utility. 4 3
SLO County Population Estimated population in SLO county In 2003 258,204 In 2050 500,000 Avg. household size in SLO county = 2.53 = 258,204/2.53 = 102,057 households Average household electricity use in California = 584 KWh/month = 7008 KWh/year http://quickfacts.census.gov
Small Medium Large New SunPower product: maximizing yearly energy productionsolar cells to generate up to 50% more power than traditional products ( www.SunPower.com) http://www.consumerenergycenter.org/renewable/estimator/index.html
Considerations Efficiency increases from 11% - 23% Solar cells generates 50% more power Price remains the same for the first 5 years (decreases by 5% for second installment and 10% there after)
Roof Installment Price decreases Second inst. by $ 1.4M (each system $700) Third inst. by $5.9M (each system $1475)
Agenda • Introduction • Solar Roof for SLO County • Solar Plantation • Energy Storage • Mass transit • Conclusion
The Stirling Engine “If you have a fixed amount of gas in a fixed volume of space and you raise the temperature of that gas, the pressure will increase.” • No Combustion • No “Fuel” • No Exhaust http://travel.howstuffworks.com/stirling-engine3.htm
Source of Heat: Solar Concentrator • Large Parabolic Concentrator • 89 Mirror Facets • 2 Axis Sun Tracking http://www.stirlingenergy.com/products.asp?Type=solar
Power Conversion Unit (PCU) • Four Sealed Cylinders • Power Output: 480 V @ 60Hz • Power-Conditioned by the Generator’s Interface http://www.stirlingenergy.com/products.asp?Type=solar
Comparison to Photovoltaic About 3x More Power per Area! http://www.stirlingenergy.com/products.asp?Type=solar
An example site: Carrizo Plains Originally 120 Acre 6 MW Solar Photovoltaic Power Facility With SES Units: approx 36.5 MW on same 120 Acres
Current Price: $250k/unit Cost Each Unit Generates 25kW Units needed for Carrizo Plant: 1460 Cost if built today: $365 million BUT Manufacturing is ramping up soon and costs are expected to drop rapidly, Target Production Price: $50k/unit New Cost: $73 million 40 Dish 1MW facility in CA in early 2006 20,000 Dish 500 MW facility in South West next http://www.memagazine.org/pefeb05/runlong/runlong.html http://www.popsci.com/popsci/science/article/0,20967,1018934,00.html
Time to Pay Off Time in years to pay off = -log( 1-iA/P) / (log(1+i) i = interest rate = .06 (prime) A = Loan Amount = $73 million P = Payment Amount = profit from selling the energy = (Selling Price – Cost) * Capacity = ($.12 - $.06) per kWh * 82.65E6 kWh = $4.959 million Time = 36.86 years http://oakroadsystems.com/math/loan.htm
The Big Plan: Assumptions • Cost of producing electricity fixed at $.06/kWh • Selling price of electricity constant • Cost of manufacturing down $10k/unit/1st 10yrs, $5k/unit/10yrs after • Energy use per capita constant • Loan rate constant at 6%
The Big Plan Yearly Income After: 2041: $33.966 million 2047: $220.78 million 2053: $373.63 million
Agenda • Introduction • Solar Roof for SLO County • Solar Plant • Energy Storage • Mass transit • Conclusion
Methods of Power Storage • Battery (Lead-Acid, Metal- Air, Polysulfide Bromide) • Capacitor • Flywheel • Compressed-Air Energy Storage (CAES) • Hydro Pump Storage
Helms Hydro Pump SystemFresno,CA • 1125-MW underground pumped • 1,600 feet elevation difference • Project Completed 1982 • Cost $380 million
Agenda • Introduction • Solar Roof for SLO County • Solar Plantation • Energy Storage • Mass transit • Conclusion
SLO County Mass Transit SLO Transit – San Luis Obispo Transit CCAT – Central Coast Area Transit SCAT – South County Area Transit PRCATS – Paso Robles City Area Transit
Mass Transit Statistics SLO Transit • 11 buses in service (9 diesel & 2 natural gas) • 392,462 annual vehicle miles (2003) • 4 mpg average fuel economy • 98,115 gallons/year CCAT/SCAT • 23 buses in service • 1,135,676 estimated annual vehicle miles (4 mpg) • 283,919 gallons/year PRCATS • Estimated 6 buses in service • 198,360 annual vehicle miles (2004) • 49,590 gallons/year Information provided by National Transit Database (2003)
Mass Transit Statistics • 40 SLO county buses currently in service • 431,624 gallons of diesel/year total consumption for SLO county busing • 1,726,498 total SLO county bus miles • Alternatives to diesel buses • Diesel-Hybrid systems • Electric
Energy Consumption Economics of Bus Drivelines, Department for Transport, UK
Energy Savings • Current diesel buses • 6 kWh/km/bus • 667 MWh annual for all buses • Diesel-electric hybrid buses • 3 kWh/km/bus • 330 MWh annual for all buses • All-electric buses • 1 kWh/km/bus • 110 MWh annual for all buses
Energy Cost Analysis • Diesel Busing • $2.26/gallon at the pump • 431,624 gallons/year • $975,470/year • All-Electric Busing • PG&E Rate Analysis Tool • A-1 Small General Service Rate ($0.12 to $0.18/kWh) • 9200 kWh/month average estimate • $16,788/year
Current Electric Bus Technology • Dept. of Transportation (2003) • Successful performance test took place in Rome, NY • Electric bus showed 145 mile range under urban conditions • Previous range record was 127 miles • Further testing set to take place in August, 2004 • 312 kWh main battery and 22 kWh reserve Information provided by www.electric-fuel.com
Current Electric Bus Technology Images courtesy www.electric-fuel.com
Conclusion • All-electric busing is feasible in SLO county • NY has implemented a few all-electric bus routes successfully • Considerable energy and financial savings • Zero emissions • Large initial investment to replace all buses • Alternatively, county could replace old diesel buses with electric ones as they expire
Agenda • Introduction • Solar Roof for SLO County • Solar Plant • Energy Storage • Mass transit • Conclusion
2050 Power Budget • Assuming adequately sized power storage All generated power is used (minus conversion inefficiencies)
2050 Financial Summary • Total one-time costs: • All one-time costs paid off by ~2050
2050 Financial Summary • Long term benefits
The Big Plan – A Summary • Generation • Phase solar roofing into new construction • Reduces the average household need • May even supply additional power to the grid • Solar power plants • Sterling engine / Parabolic concentrator
The Big Plan – A Summary • Usage • Large storage solution • Aim to retain and use (almost) all generated power • All-electric public transportation vehicles • More feasible than trying to affect the direction of the entire auto industry • Inherently more efficient and should be better promoted anyway
Questions, Comments? • Open for discussion


![[Solar PV]x[Microgrids] The Matrix Solution](https://cdn1.slideserve.com/3035202/solar-pv-x-microgrids-the-matrix-solution-dt.jpg)