Download
1 / 39
390 likes | 639 Views
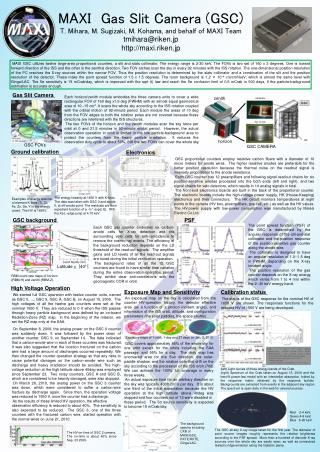
Status of Calibration and Data Analysis of MAXI GSC. M. Sugizaki (RIKEN) on behalf of MAXI Team. Outline. In-orbit Operation and Performance HV Operation History Background, Sky Coverage, Exposure Calibration Status Alignment (Position) Light curve (Effective area)

E N D
Status of Calibration and Data Analysis of MAXI GSC M. Sugizaki (RIKEN) on behalf of MAXI Team GSC Calibration and Analysis Status
Outline • In-orbit Operation and Performance • HV Operation History • Background, Sky Coverage,Exposure • Calibration Status • Alignment (Position) • Light curve (Effective area) • Spectrum (Response matrix) • Data Reduction and Analysis Process • Event data reduction, All-sky Image • Pre-registered source archive • Light curve, Spectrum, Image • Future Plan GSC Calibration and Analysis Status
HV Operation History • GSC operation started on 2009/8/15 with a nominal 1650V for full 12 counters. • 4 out of 12 counters suffered from breakdownwithin the first 2 months. The damage on carbon-anode wire by heavy particle irradiation is suspected. • Operation at high earth latitude (Lat.>40o) was stopped. • One another camera stopped on 3/23/2010. The nominal HV is reduced to 1550 V for suspicious counters. Count-rate map of Radiation-Belt Monitor • Observation Efficiency • Detectorarea 8/12=66.6%, • Effective exposure 40% of the pre-flight plan. GSC Calibration and Analysis Status
Exposure Map (since 2010/1/2 00:00:00 UT) 1 orbit = 92 minutes 1 day 85% sky coverage 95% sky coverage 27 days 1-day exposure = 4000 cm2s (typical) Thanks to the two FOVs (horizon/zenith) and redundant design, almost full sky are covered every orbit! 100% full sky is covered by 3 weeks GSC Calibration and Analysis Status
Daily Exposure for a Celestial X-ray Source Example: Crab Initial 2 month 1-day exposure = 4000 cm2s (typical) 2009 8/12 2010 11/30 GSC Calibration and Analysis Status
Background and Sensitivity 5-s sensitivity ~ 15 mCrab per day • CXB Confusion is included • GSC BGD rate ~2 mCrab at 4keV, ~ 10 mCrab at 10 keV • Comparable to the Ginga-LAC Ginga/LAC MAXI / GSC RXTE/PCA GSC Calibration and Analysis Status
Instrument Calibration • Position Accuracy • Effective area • Energy response • Timing GSC Calibration and Analysis Status
Attitude and Alignment Calibration(See Poster P-59 by Sugimori et al.) • Attitude of MAXI payload module is always monitored by ADS (Attitude Determination System) using Visual Star Camera and Ring Laser Gyro. Its accuracy is << 0.1 deg. (calibration is in progress) • Source position of incident X-ray is determined from the attitude and alignments of collimator and detector. • These alignments can be calibrated using standard X-ray sources whose positions and intensities are well-known. GSC Calibration and Analysis Status
Alignment Cal. Progress(See Poster P-59 by Sugimori et al.) • Sco X-1 90% containment radius 2010/01 2009/08 0.14 deg 0.9 deg Estimated systematic uncertainty = 0.2o PSF 5o GSC Calibration and Analysis Status
Effective Area and Light Curve Observed count rate for stable point source (simulation) Modulated by triangular transmission function of slat collimator 1 scan per 92 minutes Effective-area correction Area-corrected light curve 20 min. 15 scans per day 1bin=1orbit(90min) 1 day Sun 1bin=1day SAA 100 days 100 days Area variation due to source acquisition angle Ideal case ! GSC Calibration and Analysis Status
Effective area correction of real data • Light curve of Crab Nebula (on the MAXI public web) • Soft X-ray band has a large systematic errors for insufficient calibration of absorption at the beryllium window, hardware/software LD variation, … • Med/Hard Bands are OK. • Background subtraction error • Down time for occultation by solar-battery paddle are implemented. However, the precision is not good enough. • Occultation by docked shuttle vehicle was not implemented. 1.5-20 keV 1.5-4 keV 4-10 keV 10-20 keV GSC Calibration and Analysis Status
Light Curve by Updated Process Crab • Info of in-orbit energy-response is implemented. • gain variation • LD change • Data of a few anodes (2 out of 6 wires) withextraordinaryresponses are ignored. • 1650 V data only • Need more extensive response calibration to use full data. GSC Calibration and Analysis Status
Energy Response: CALDB from ground tests Gain: YZ map Effective area Gain: XY map on gas counter Energy-PHA response matrix PHA channels Energy resolution map Energy [keV] GSC Calibration and Analysis Status
Response Builder ★X-ray source (RA, Dec) Weight map on detector plane Slit GSC cross section collimator Energy-PI Response Matrix detector PI channels DetX PHA(DetX,DetY) PI Energy [keV] GSC Calibration and Analysis Status
In-orbit Calibration (Nakahira et al.) • The gas gains should increase from the ground test. ~ 2-10% • The detector gas cells expanded in the vacuum. • The ground calibration test would suffer from the space charge effects. The test was done with high-rate pencil X-ray beam. Ti Data: BGD spectrum including Ti, Cu lines Model: folded with a response built from ground CALDB Cu GSC Calibration and Analysis Status
Crab Spectrum fit • 2009/8/15 1-day all available GSC data • Data of anode #1,#2 are currently not used for their insufficient calibration. (They have an extraordinaryresponse.) • Applicable to 1650V data only Wabs*Powerlaw Model parameters: NH = 0.72 +/- 0.22 G = 2.15 +/- 0.05 Norm. = 11.4 +/- 1.0 c2n = 1.08 Reasonably agree with standard Crab model GSC Calibration and Analysis Status
GSC Event Timing • GSC event data has a 50-ms time resolution • MAXI DP time clock can always be calibrated using on-board GPS. • Timing will be calibrated by Crab pulsar, ms pulsar, binary X-ray pulsars. Event timing scheme Data Processor GSC Elec. Time Clock 1s Gas Counter Free-Run Clock 50 ms GPS 1s Free-Run Clock 1 ms UTC time and sec. trigger Latch FRC on DP-clock trigger Latch FRC on event trigger Reset DP FRC on GPS trigger GSC Calibration and Analysis Status
Timing Cal. with Crab Pulsar (Yamamoto, Morii) GSC every 3-day folded pulse • Period, stability is verified (10-9) • Need calibration of absolute timing Comparison of pulse period with radio-pulse period Dot line: Radio (Jodrell Bank) Red, green:MAXI ……. Residual 2010 1/30 2009 10/30 Epoch Time (3 months) GSC Calibration and Analysis Status
Calibration Summary • Effective Area, Energy response • Acceptable Level • HV=1650V data • Med (4-10keV), Hard Band (10-20 keV) • Not ready, Unacceptable • HV=1550V data. 3 out of 8 operating counters. Important to optimize the observation efficiency. • Soft band (<4 keV): Error ~25% if anode#1,#2 is included. • Timing • Stability is good in 10-9 level verified by Crab pulsar • Absolute-timing calibration is necessary. GSC Calibration and Analysis Status
Data reduction, Analysis, and Archive GSC Calibration and Analysis Status
Data Reduction and Analysis flow (for standard daily data products) These processes run once per day. All required data are dumped into files (FITS formatted). ISS telemetry For each target • light curve • image • spectrum • HK file • GSCHK • ISSANC • … every second Database (MAXIDB) • Response • Effective area curve • (RMF) • AUXIL file • attitude • orbit • time MKF CALDB • raw count rate • image • (spectrum) target event file Real-time transient search raw event file processed event file cleaned event file Time Coordinate PI (energy) Negro talk Ozawa, Suwa (P-63,64) Standard HEADAS-format tools are used. GSC Calibration and Analysis Status
Data Archive Products (http://maxi.riken.jp) • Daily All-sky Image (3-10 keV band) • Pre-registered sources (~ 200 targets) • Light Curve • Daily Image 1.5-20 / 1.5-4 4-10 / 10-20 keVband • Daily Spectrum (first 10 targets) GSC Calibration and Analysis Status
Daily Spectrum Archive (test phase) • Archive of first 10 targets starts on 10/28 • Crab, Sco X-1, Cen X-3, Her X-1, GX 9+9, GX 9+1, GX 13+1, GX 17+2, GRS 1915+105, Cyg X-2 • Source, BGD spectra and response file for each UT day. • Best-fit wabs*power-law model Crab 2010/10/1 GSC Calibration and Analysis Status
Crab Daily Spectral Parameters (2009/08/15 - 2010/10/31) Photon index Absorption column density • Error bar: 90% conf. limit • NH: slightly higher than the standard value • Automatic analysis process is not always perfect. Crab standard model Flux (2-10 keV) GSC Calibration and Analysis Status
Archive Update Plan • Light Curve • Soft-band calibration, Use 1550-V counter data • Early update (1.5-day delay in the current process) • Energy Spectrum • Response calibration of the soft band and 1550-V data • Increase archive targets • Data Access • Spectrum data of only the latest one day is accessible in the current test phase. • Extension of daily-base archive over the first year is not difficult. It will come soon. • More flexible data access will be important to increase the MAXI data analysis and the science outputs. GSC Calibration and Analysis Status
Final Remarks • MAXI justcompletedthe first year operation. • Although there were a some troubles for the special environmental on the ISS, the operation is getting stable. • The calibration, data analysis environment, archive system are now being developed and close to ready. • The time to enjoy the data will come soon ! GSC Calibration and Analysis Status
Backup GSC Calibration and Analysis Status
In-Orbit Environment on ISS • Orbit: Alt.=340-360 km, Period~92 min. Incl.=51deg • Ginga,…,Suzaku : Alt.=530-590 km, Period~95 min. Incl.=31 deg. • XTE: Alt.=580 km, Period~100 min. Incl.=23 deg. • Large ISS structure. ~108 m, ~408 ton Direction of Motion GSC Calibration and Analysis Status
GSC on MAXI FOV of 6 cameras Gas Slit Cameras (GSC) Xe-filled proportional counter 2—30 keV; 5350 cm2 GSC-Z 80cm 107cm GSC-H FOV of 6 cameras ISS motion 160o 1.5o(FWHM) GSC Calibration and Analysis Status
Scan Observation for a Celestial Target 1/4 cycle from H to Z • Effective-area curve for a point source slat-collimator transmission function duration ~ 40 sec. (typical) 1 scan per 92 min duty cycle ~ 0.8 % (typical) 1/3cycle 25 min. Outage for SAA ~ 15 scans 1 day 1 day GSC Calibration and Analysis Status
Point-Spread Function (PSF) • PSF along anode wire GSC Calibration and Analysis Status
Scan-Transit Profile GSC Calibration and Analysis Status
Residual BGD Spectrum COR dependence suggests that the origins are cosmic rays whose momentum is over the selection criteria. MIP energy loss ~ 40 keV Cu-K Ti-K GSC Calibration and Analysis Status
BGD Spatial Distribution Sensitivity gap for support structure Efficiency of anti-coincidence cut is downed at the counter edge Residual BGD profile is almost flat. Anode wire (250 mm) GSC Calibration and Analysis Status
In-orbit BGD-rate Variation • BGD-rate v.s. cutoff-rigidity relation GSC Calibration and Analysis Status
Samples of early archive products (http://maxi.riken.jp) • Daily all-sky map • Light curve, image, (spectrum) of pre-listed sources (130 sources on 4/10/2010) GSC Calibration and Analysis Status
90% containment (other sources) Crab 0.16 deg Cyg X-1 0.18 deg GX349+2 0.21 deg GRS1915+105 0.17 deg Cyg X-2 0.17 deg GSC Calibration and Analysis Status
GSC HV-Down Area 2009 8/15-9/23 • SAA 2009 9/23- • SAA • |Latitude|>40o GSC Calibration and Analysis Status
HV operation efficiency 2009 9/23 Redundant GSC_0 GSC_6 GSC_1 GSC_7 80% GSC_2 GSC_8 40% GSC_3 GSC_9 GSC_4 GSC_A GSC_5 GSC_B 2010 11/30 2009 8/12 2010 11/30 2009 8/12 GSC Calibration and Analysis Status