Download

1 / 16
160 likes | 296 Views
Analysis of Observational Studies. Biost/Stat 579. David Yanez Department of Biostatistics University of Washington. Observational Studies. Scientific question(s) Challenges Control of bias Confounding Measurement Sampling Inferring casual relationships Scientific plausibility

E N D
Analysis of Observational Studies Biost/Stat 579 David Yanez Department of Biostatistics University of Washington
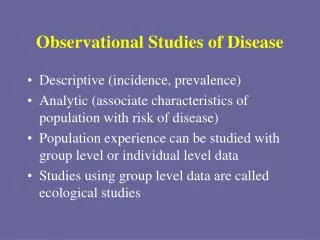
Observational Studies • Scientific question(s) • Challenges • Control of bias • Confounding • Measurement • Sampling • Inferring casual relationships • Scientific plausibility • Cause precedes effect • Strength of assocation • Dose-response relationship
Definitions • By observational study, we mean any study that does not involve random assignment of units to different conditions. • Does parental smoking cessation discourage adolescent smoking? (Farkas et al. 1999) • Study of physical activity and risk of prostate cancer in US physicians (S. Liu et al. 1997) • Primary concern is with studies designed to determine the association between a condition, exposure, or treatment on some outcome.
Determining the Scientific Question • In randomized experiment, there is (usually) not much confusion • What is the effect of the intervention (whatever was randomly assigned) on the outcome. • There may be some confusion about this, i.e., which outcome… • The first difference we encounter in observational studies is that we should try to avoid use of the word “effect” because we typically cannot infer a causal relationship. • One should use terms like “association” or “prediction” to describe the results.
Example • Predicting obesity in young adulthood from childhood and parental obesity (Whitaker et al, 1997). • This study includes both types of question: • Does childhood obesity predict adult obesity (first statement in conclusions), • Does parental obesity influence child obesity (second, bolded statement in conclusions).
Example (cont.) • For the first question, the authors are quite careful to examine the predictive value of childhood obesity. • Even though obesity in young children (1-2 years) is predictive of obesity later, most obese young children will not be obese adults, so “physicians should avoid labeling these children as being at risk for later obesity” (from discussion). However, in late childhood the child’s obesity becomes more of a concern. • The second question also has a predictive aspect (it helps identify children at risk of obesity), but there is also a desire to uncover a causal relationship—note that parental obesity is predictive even after adjustment for the child’s own obesity status (underlined in abstract). • In the discussion, we see possible mechanisms for this finding (genetic and environmental factors).
Challenges in the analysis of observational studies • “Analysis by Design” Principle holds, i.e., statistical analysis should parallel the design of the study . • Issues that apply to both randomized and observational studies: • Choice of outcome variable and test statistic, modeling assumptions, power, and missing data • Approach to testing is often less formal. • Issues that differ between randomized and observational studies: • Imbalance between treatment groups is expected in observational studies • Adherence to certain treatments, lifestyles, etc., is the very thing being studied in an observational study • In a randomized clinical trial the patient’s lack of adherence prevents us from learning the effect of the assigned treatment • The possibility of bias is the most important issue in the analysis of observational studies.
Major sources of bias • Bias due to Confounding. • A confounding variable is one that has a causal effect on both the predictor variable and the outcome variable. • Attempt should be made to control known confounders in an analysis. • Potential problems: • We don’t know what the confounders are • We haven’t measured all the confounders • The confounder variables are measured poorly • One has to guard against controlling for effects on the causal pathway and adjusting away part of the association you’re interested in. • Important point: • Don’t use statistical significance as a criterion for selecting potential confounders
Examples • Does parental smoking cessation discourage adolescent smoking? • Confounding by effects related to demographic/socio-economic status is a possibility so the analyses controlled age, education, and income of the father (why not mother too?) as well as “demographic characteristics of the adolescents” (sex, ethnicity,…?). • Predicting obesity in young adulthood from childhood and parental obesity. • For prediction, confounding is not relevant so no adjustment should be done.
Measurement Bias • Measurement error can cause bias if it is random or systematic • Random measurement error will typically attenuate (reduce the magnitude) of an association. • Systematic measurement error can bias an association in either direction. • Ex: Does parental smoking cessation discourage adolescent smoking? • Could self-report of smoking be systematically biased? • Ex: Predicting obesity in young adulthood from childhood and parental obesity. • Measurements of height and weight likely to be biased?
Sampling Bias • Sampling biasincludes both bias due to un-representative sampling and bias due to attrition or missing data. • Ex: Does parental smoking cessation discourage adolescent smoking? • The selection of the sample used random sampling (Current Population Survey) so should be representative. • Results were weighted for non-response; amount of non-response is unclear. • Ex: Predicting obesity… • Participants were members of GHC born 1965-1970 with 1+ outpatient visit after age 21. Necessary data available was only 64%. • Potential for missing-data bias is unclear…
Criteria for Inferring Causal Relationships from Observational Studies • Scientific Plausibility • Is there theory to support the findings? • Are there no alternative explanations for the findings? • Is there agreement with other studies using different designs and populations? • Cause precedes effect? • Not only must the cause come before the effect but, ideally the cause is measured before the outcome is measured. • Main reason that prospective studies are better than retrospective longitudinal studies and cross-sectional studies.
Criteria for Inferring Causal Relationships from Observational Studies • Ex: Does parental smoking cessation discourage adolescent smoking? • Cross-sectional analysis of the association between parental smoking association and their children’s smoking, • Retrospective analysis of the effect of the age of the child when the parent quit. • Ex: Predicting obesity… • This study was a retrospective longitudinal study that relied on historical medical records for weight and height.
Criteria for Inferring Causal Relationships from Observational Studies • Strength of the Association • The larger the magnitude of the association, the stronger is the evidence for a causal relationship, all else being equal. • Why? • A small association (eg, RR < 1.5 or RR < 2) could be due to bias. • A large association (eg, RR > 3) may not be explainable in terms of bias. • Ex: Parental smoking cessation • Associations were small (one-third reduction in risk). • Ex: Predicting obesity • Associations varied from the small (OR 1.3), to the medium (OR 2.2, 3.2), to the very large (OR 17.5).
Criteria for Inferring Causal Relationships from Observational Studies • Dose-Response Relationship • The evidence is stronger if the association increases monotonically with the amount of the cause or the period of time of exposure to the cause. • The reason is that such a finding would be attributable to bias only if the sources of bias displayed this monotone pattern. • Ex: Parent smoking cessation • the prevalence of children’s smoking increased monotonically with the age at which their parents quit smoking (see bolded statement in conclusions).
Criteria for Inferring Causal Relationships from Observational Studies • Specificity of the Association • Is the cause associated only with the effect of interest or is associated with other unrelated outcomes as well? • Associations with other outcomes (especially ones for which there is no scientific plausibility) raise suspicions of bias. • Important to consider in reviews or meta-analyses where one can gather evidence from different studies using different outcomes.