Download
1 / 11
110 likes | 352 Views
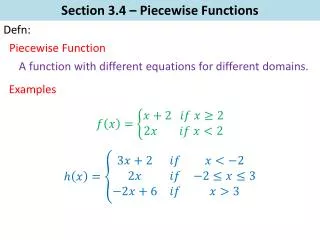
Topic: Piecewise-defined Functions section 2.5 part 1 Unit: Graphing Functions. Teacher: Hedy Cohen Course:Math Analysis Period: 4a, 4b Date: October 22, 2012 Resources: Precalculus with Limits 5 th edition. Warm-up:

E N D
Topic: Piecewise-defined Functions section 2.5 part 1Unit: Graphing Functions Teacher: Hedy Cohen Course:Math Analysis Period: 4a, 4b Date: October 22, 2012 Resources: Precalculus with Limits 5th edition
Warm-up: State the interval(s) that the graph is increasing , decreasing and constant.
#1 1.What would be your wage in 1970? 2. What would be your wage in 1950? 2. What does x represent? 3. What is the domain of the function?
#2 • State the interval(s) that the graph is increasing , • decreasing and constant. What does x represent?
#3 You have a job where you earn $12.00 per hour for up to 40 hours per week. If you work more than 40 hours per week, your hourly wage for the extra hours is 1.5 times your normal hourly wage of $12.00. The function is modeled below. a. How much would you earn in a week that you worked 30 hours?b. How much will you get paid if you work 48 hours? c. What does the 480 and the 18 represent in the second equation? d. What is the domain of the function? What does it represent?
#4 • Describe the transformation from Horizontal stretch by a factor of _______________. Horizontal shrink by a factor of _________ Horizontal shift to the _________ __________units. Reflection over the _________ axis. Vertical stretch by a factor of ________________ . Vertical shrink by a factor of _____________ Vertical shift _______ __________units. Domain and range of g(x) Domain:_________________________ Range:__________________________
#5 Use the accompanying graph y = f(x) to state the new points for the point (-4,-2) for each transformation.
#6 Solve by graphing. Show your graph.
#7 • State whether each function is even, odd or neither. • Show how analytically how you determined your answer (check). • y = x4 + 4x +1 • y = x5 • y = x4 + 2x2 +5
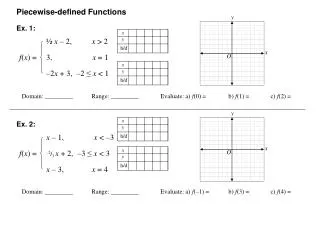
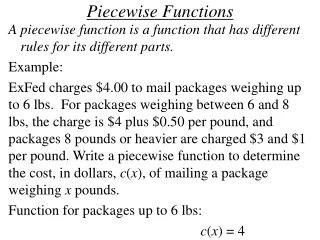
#8 Piecewise-Defined FunctionsGraph the piecewise function. f(x) =
#9 Describe how the graphs of the functions below are alike and how they are different. Use mathematical terminology.