Download
1 / 25
250 likes | 465 Views
Graph Analytics on Massive Collections of Small Graphs. Dritan Bleco Yannis Kotidis Department of Informatics Athens University Of Economics and Business. dritanbleco@aueb.gr. kotidis@aueb.gr. EDBT 2014 - Athens. Outline. Motivation Graph Records & Queries

E N D
Graph Analytics on Massive Collections of Small Graphs DritanBlecoYannisKotidis Department of Informatics Athens University Of Economics and Business dritanbleco@aueb.gr kotidis@aueb.gr EDBT 2014 - Athens
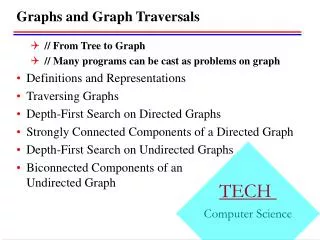
Outline • Motivation • Graph Records & Queries • Storage of Graph Records and Indexing using a Column Store • Graph View Materialization • Selection of Graph Views • Extensions • Experiments • Conclusions Dritan Bleco
Motivational Example • Focus on small graphs that are generated continuously • Examples: data from CRM , WMS and SCM applications • Difference between our targeted applications and other applications of graphs (e.g. social web, biology) • Not a single massive graph but a massive collection of smaller graphs • Nodes/ Edges are mapped to real world entities • Thus, no need for isomorphism discovery Dritan Bleco
Framework Overview • Our framework puts together three different techniques • A column-oriented relational backend to permit a flat description of the graph records. • Alleviates recursion and costly joins for path calculations (required in a straightforward relational implementation) • A very efficient indexing mechanism using bitmap columns • Analogous to bitmap indexes frequently used in DWs • This model is generic and can accommodate specialized graph indexes (for example the gIndex) • A framework that permits the creation and reuse of materialized graph views of different types • These views improve query times especially for aggregation queries Dritan Bleco
Region1 E A D I G F J B Region2 K H C Production Lines Hubs Customer Locations Own Route Leased Route • QUERIES • Delivery Time for products shipped via [A, D, E, G, I] path • Delivery Cost for products shipped using Leased Routes • The longest delay for products shipped from Region 1 to Location I via Hubs of Region2 Dritan Bleco
Primitive Query Types • Graph Queries • Find records that contain a given query graph Gq • The result is the record id with the respective measures of each matching record • For example return delivery times along all hops in [A, D, E, G, I] • Aggregate Graph Queries • A Graph Query Gq with the addition of a user-defined aggregate function f • The result is the aggregation of the measures along all maximal paths (paths connecting sink and terminal nodes in Gq) • E.g. total delivery time for all shipments via [A, D, E, G, I] Dritan Bleco
Graph Queries C Record 1 B 3:2 2:4 1:3 5:2 4:1 E D A Record 2 3:2 C 2:1 6:4 7:1 E A F G 4:2 5:3 D Record 3 6:3 7:1 E A F G 5:4 4:5 D Find records that follow path [ACEF] Result : r2 , AC:1, CE:2, EF:4 (record id , related measures) Dritan Bleco
Graph Aggregate Queries C Record 1 B 3:2 2:4 1:3 5:2 4:1 E D A Record 2 3:2 C 2:1 6:4 7:1 E A F G 4:2 5:3 D Record 3 6:3 7:1 E A F G 5:4 4:5 D Find records and the total (sum) cost for path [ADEF] Result : r2 , ADEF:9 (record id, aggregated measures) r3,ADEF:12 Dritan Bleco
Storage Model Record 1 C B 3:2 2:4 1:3 5:2 4:1 E D A Record 2 3:2 C 2:1 6:4 7:1 E A F G 4:2 5:3 D Record 3 6:3 7:1 E A F G 5:4 4:5 D Dritan Bleco
Bitmap Columns – a simple index Record 1 C B 3:2 2:4 1:3 5:2 4:1 E D A Record 2 3:2 C 2:1 6:4 7:1 E A F G 4:2 5:3 D Record 3 6:3 7:1 E A F G 5:4 4:5 D Dritan Bleco
Queries using Bitmap Columns B C E F G A D GraphAggregate Query Get the total cost delay of [ACEF] path Select recid, m2 + m3 + m6 where b2=1 AND b3=1 AND b6=1 Graph Query Get the costs delay of [ACEF] path Select recid, m2, m3, m6 where b2=1 AND b3=1 AND b6=1 Dritan Bleco
Graph View Materialization • Materialized Graph Views • Used for Graph Queries / Aggregate Graph Queries • Implemented as bitmaps resulting from ANDing the edges of a subgraph derived (by our techniques) from a set of graph queries • These bitmaps are added as a new columns in the database • Materialized Aggregate Graph Views • Used for Graph Queries / Graph Aggregate Queries • A Bitmap (as in a Graph View) and pre-computed aggregates • Bitmap is the corresponding materialized Graph View • Aggregates are derived from the measures stored in graph records Dritan Bleco
Materialized Graph Views B C E F G A D Query Q1 = Get the cost delay of [ACEF] path Select recid, m2 ,m3 ,m6 where bq1=1(b2=1 AND b3=1 AND b6=1) Materialized View for Q1 : bq1= b2AND b3ANDb6 Dritan Bleco
Materialized Aggregate Views B C E F G A D Query Q1 = Get the total cost of [ACEF] path Select recid, mq1 (m2 + m3 + m6) where bq1=1 (b2=1 AND b3=1 AND b6=1) Path Aggregated Q1: bq1 = b2AND b3ANDb6 mq1 = m2+ m3 + m6 Dritan Bleco
B C E F G A D Another Query can use the materialization of Q1 Q2 = Get the total cost delay of [ACEFG] path Select recid, mq1 + m7(m2+ m3+ m6 +m7) where bq1=1 AND b7=1 (b2=1 ANDb3=1 ANDb6=1 ANDb7=1 ) Aggregated Q1 : bq1 = b2 AND b3AND b6 mq1 = m2+ m3+ m6 Dritan Bleco
Re-use of materialized graph views • See our past work "Business Intelligence on Complex Graph Data", BEWEB, Berlin, Germany, March 2012, • How to formulate complex graph expressions using a set of intuitive operators we define • How to best answer a user query using materialized (Aggregate or not) Graph Views? • A simple cost model based on the number of bitmaps required for answering a query • Mapped to a set cover problem • Solved via a greedy algorithm • Details are in the paper. Dritan Bleco
What to materialize? • Aggressive materialization: Materialize whole queries • Often not possible due to space limitations • Our approach: Query Driven Graph View Selection • First need to derive a set of candidate views • Naïve approach : Consider all subsets of the edges in the Union of all Query Graphs • Exponential number of candidates (thus not feasible) • Many redundant Views • Intuition: Prune candidates based on a monotonicity property Dritan Bleco
Candidate Generation B C J E F G H A D Frequent Query Set {[ACEFGHJ], [ADEFGHJ]} Monotonicity Property : Graph View Gv ’ supersedes Graph View Gv iff Gv Gv ’ and Gq : Gv Gq ⇒ Gv ’ Based on this property we only consider the following candidates : Each query graph +{[ACEFGHJ], [ADEFGHJ]} All the subgraphs that are intersection between 2 query graphs +{[EFGHJ]} All the subgraphs that are intersection between 2 graphs of the previous step until no more new views are created The view selection from candidate set mapped as set a cover problem Dritan Bleco
Extensions All data are be stored in a single relation But obviously can be partitioning in more than one relation Can easily incorporate Specialized Graph Indexes (for example the gIndex) Dritan Bleco
Experiments • Graph records from two datasets • * NY: Depicts New York roads and • **Gnutella: Describes connections among Gnutella hosts from August 2002. • Experimental evaluation among 4 systems • Commercial Row Store Relational DB • Column Store Relational DB • Neo4j • Commercial Native RDF DB • * http://www.dis.uniroma1.it/~challenge9/download.shtml • ** http://snap.stanford.edu/data/p2p-Gnutella05.html Dritan Bleco
Comparison to alternative Systems (no views) • Our System provides almost constant query times with increasing graph query size as fewer records are retrieved (even though more bitmaps are being used) • Column store not affected from increasing density (% edges in a record) Dritan Bleco
Benefit of Using Graph Views • Graph views provide savings of up to 32% in query times • there is a mandatory cost for fetching the records that is not affected by materialization • Thus, more savings are seen in aggregate queries • using 100 aggregate graph views reduce the execution time by 89% • Larger gains when queries exhibit skew (graphs in the paper) Runtime for 100 uniform Graph Queries Runtime for 100 uniform Aggregate Graph Queries Dritan Bleco
Using Additional Indexes • gIndex (record driven): trained the index using records that are part of the query result set • It took about 24 hours to process about 100.000 records • Graph views (query driven) result in up to 6 times faster query processing times • It ran in less than one second gIndex in 100 uniform Graph Queries gIndex 100 uniform Aggregate Graph Queries Dritan Bleco
Conclusions • Presented a framework where both data and queries are modeled as abstract graph structures • Abstracted two primitive query graphs • Introduced two types of Graph Views for expediting queries • Discussed an efficient mechanism for selecting a set of non-redundant views • Answering queries using Graph Views by solving an instance of a set cover problem • Argued for a simple yet effective representation of graph records using a flat relational model implemented in a column store • Introduced bitmap indexes for efficient query processing • Graph Views are stored within the same relational schema • Presented experimental results using datasets consisting of hundreds of millions of graph records • Experimental results show that our platform is orders of magnitude faster than • A straightforward relational implementation • Alternative systems that natively handle graph data. Dritan Bleco
Thank you, Questions? Dritan Bleco