Download
1 / 36
360 likes | 383 Views
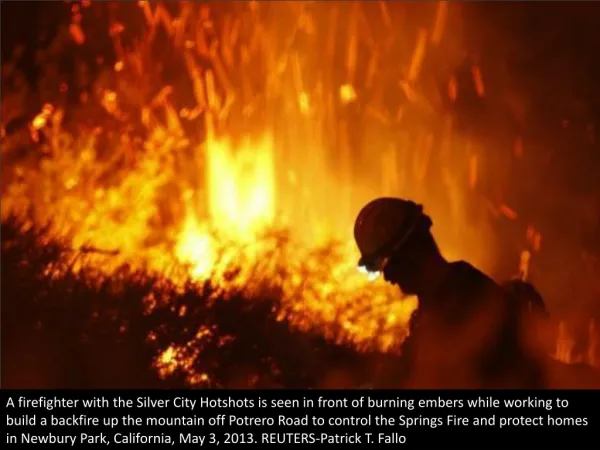
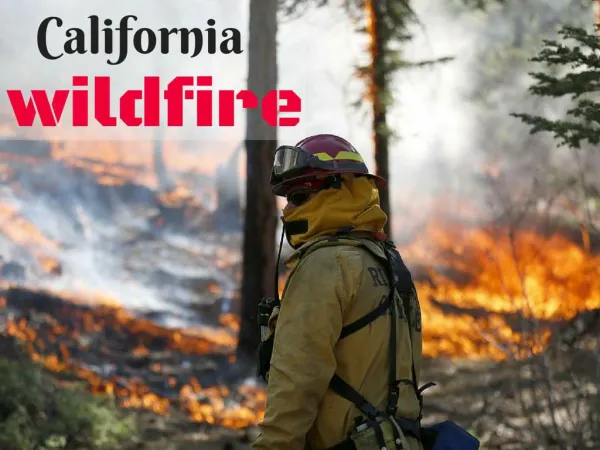
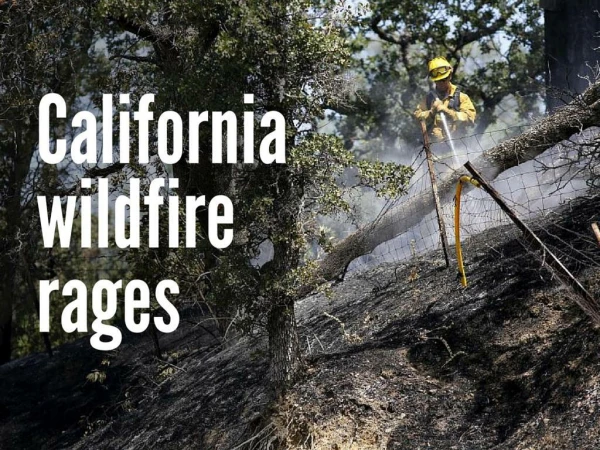
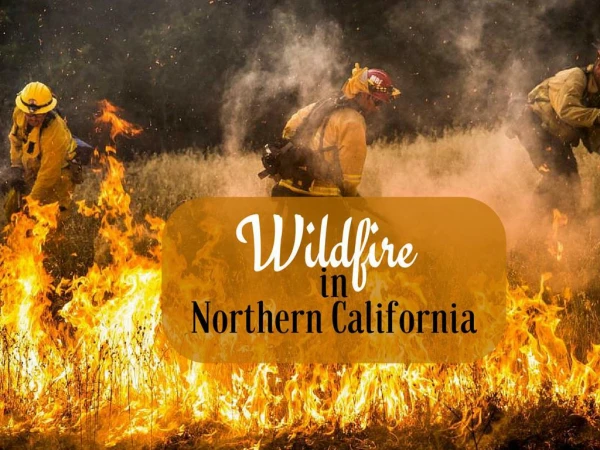
Investigating the impact of wildfires in Southern California using machine learning algorithms to map and monitor burn severity, fire behavior, and ecosystem damage. The research aims to improve wildfire risk analysis and assess the success of existing monitoring efforts.

E N D
John Rogan jrogan@clarku.edu Geography Department Clark University Mapping Wildfire Disturbances in Southern California Using Machine Learning Algorithms
Research Context • Land cover/use change – Mapping and Monitoring • Growing interest in Rapid Response Information Systems • Empirical information about wildfire cause and behavior can inform wildfire risk analysis • Paucity of historic burn severity information
Monitoring Fire Effects • The physical environment and its response to fire • Factors affecting fire behavior • Ecosystem/watershed damage assessment • Evaluating success of a management ignited fire • Appraising the potential for future treatments
Existing Monitoring Efforts (BAER) Watershed Scale Source: California Department of Forestry and Fire Protection
Existing Monitoring Efforts Ecoregion Scale Source: California Department of Forestry and Fire Protection
Existing Monitoring Efforts National Scale A = Detected from satelliteB = Conventional methods Source: Canadian Center for Remote Sensing
Existing Monitoring Efforts Global Scale Source: University of Maryland Global Fire Product
Research Objectives • Test a new methodology to map fire severity in San Diego County (1985-2000) • Employ machine learning to map severity, while integrating environmental variables with spectral variables (categorical and continuous) • Examine the contribution of ancillary variables to burn map accuracy
Fire/Burn Severity • Severity - A descriptive term that integrates various phenomenological characteristics of a fire-altered landscape • Physical and biological manifestation of combustion on vegetation and soil • Direct Effects Influenced by • Fuel consumption - Topography • Crown scorch - Disturbance history • Soil heating • Bole Charring
Previous Research • Focus on mapping burn scars (coarse resolution) • Recent emphasis on burn severity/mortality/damage levels (fine-medium resolution) for impact assessment • Retrospective burn area mapping at medium resolution (e.g., Hudak and Brockett 2004—IJRS) • BUT, challenges remain…………
California Wildfire Threat Source: California Department of Forestry and Fire Protection
San Diego County
Study Area Significance • Impacts of natural disturbance processes are increasing in severity • Public lands began burning more frequently than private lands in the mid-1970s. This trend is increasing • Population increase and peri-urban spread into fire-prone areas (WUI)
Signal August May Landsat TM and ETM+ Data
Ground Reference Data Composite Burn Index Key and Benson (2000) • SITE-Dominance • Grassland (6) • Chaparral (10) • Conifer-Hardwood (5) • Mixed (12)
Haze Correction (Pre-) Band 1 Band 2 (a) (b) Band 3 Bands 4,3,2
Band 1 Band 2 Band 3 Bands 4,3,2 Haze Correction (Post-) (a) (b)
Spectral Mixture Analysis • Decomposition of mixed pixel spectral response • Production of fractional representation of sub- pixel proportions • Biophysically-meaningful estimates of land cover components
Classification Tree Analysis • A type of MLA used to predict membership of cases of a categorical dependent variable from their measurements on one or more predictor variables • Hierarchical, non-linear recursive partitioning • Structurally explicit
Desired Map Accuracy Source: Rogan and Franklin (2001)
Hardwood Grassland Conifer Chaparral Scrub Case Study Results - SMA Shade GV BV Soil Vegetation Map RMS Fire perimeter
Case Study Results – Burn Severity ACCURACY (kappa) CLASS No burn – Vegetation 90% No burn – Water 100% Severe burn 87% 82.5% Moderate burn 60% Light burn 74% No burn – Bare Soil 84%
County-Wide Results • Variable Selection by Site(s) • Grass Burn, Soil • CHP Burn, GV, Soil, Veg, Slope • CON/HDW Burn, GV, Soil, Veg, Slope, Shade • Mixed Burn, GV, Slope, Veg, Shade, Slope, Aspect • Mean Burn Map Accuracy by Site(s) • Grass 87% (SD = 11%) • CHP 81% (SD = 10%) • CON/HDW 84% (SD = 7%) • Mixed 70% (SD = 16%)
County-Wide Results • Time since fire (TSF) • Most problematic for grasslands, where TSF > 3 months • Least problematic for CHP, CON/HDW • Map accuracy • Lowest for complex classes (e.g., mixed) • Highest for simple classes (e.g., grassland) • Variable Selection • Many for complex classes (e.g., mixed) • Few for simple classes (e.g., grassland)
Implications • Map accuracy • Range – 70-80%, depending on landscape type and TSF • Subtle burn classes are least accurate • Variable Selection • Varied by landscape type (all used for complex areas) • Implication for fire risk mapping? • The larger the fire, the greater the potential for confusion caused by landscape heterogeneity
Wildland Fire Mapping Triangle Burn Severity Map Predictive Vegetation Modeling Image Processing and Enhancement Machine Learning “….search for standard methods for mapping fuels and fire regimes at high (spatial) resolutions over broad areas”. Rollins et al. (2004, p. 86)
Acknowledgements • NASA Land Cover Land Use Change Program • US Forest Service and CDF • SDSU – Janet Franklin and Doug Stow • UCSB – Dar Roberts and Alexandria Digital Library • U of Arizona – Steve Yool