Download
1 / 36
360 likes | 523 Views
Figure 2. The committee interview process. Figure 1. Timeline for the Cost Recovery and Resource Sharing Sub-committee. Figure 3. Distribution of CTSAs reflecting CRUs/CTSA. Table 1. #Surveys reporting #CRUs for n=61 CTSAs. Figure 4. Resource services offered by CRUs/CTSAs.

E N D
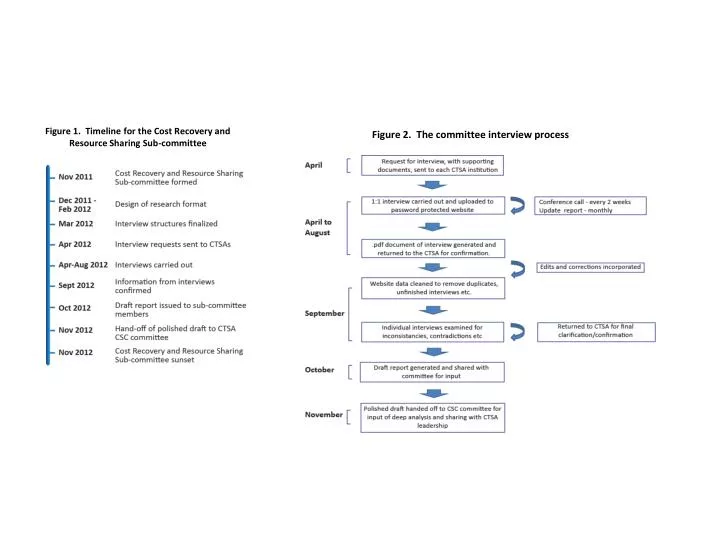
Figure 2. The committee interview process Figure 1. Timeline for the Cost Recovery and Resource Sharing Sub-committee
Fig 10 Decision drivers for CBM among those reporting “Not Yet” having CBM
Fig 12 Policies for existing studies in CRUs/CTSAs which have “Not Yet” implemented CBM.
Fig 13. Charging structures for both existing and planned programs of CBM
Fig 14 Subsidy targets to reduce cost to federally-funded project and Investigators
Figure 15 Fee Exempt Services Subsidized in CRUs/ CTSAs with existing CBMs
Figure 16 Fee Exempt Services Planned for CRUs/ CTSAs “Not Yet” having a CBM
Figure 17. The impact of CBM on the CRU/CTSA Customer Base for Existing CBMs
Figure 18. The Expectation of Impact for the CRUs/CTSAs “Not Yet” Implementing CBM
Figure 19. The impact on the customer base of the move from GCRC to CTSA for programs with CBM
Figure 20. The impact of moving from GCRC to the CTSA on those CRUs/CTSAs without a CBM*
Figure 21. The impact on Diversity and Quality among CRUs/CTSAs with existing CBM
Figure 22. The impact on Diversity and Quality expected among CRUs/CTSAs which do “Not Yet” have a CBM.
Figure 24. Impact of the move to the CTSA for CRUs/CTSAs with CBM
Figure 25. Impact of move to the CTSA for CRUs/CTSAs without CBM
Figure 27: Tension between PIs and the NIH in CRUs due to move to CTSA.
Figure 28: Tension between PIs and the NIH due to CBM in CRUs/CTSAs with existing CBM.
Figure 30. Resource Expenses as a Proportion of Total CSC/CRU Expense.
Figure 31. Proportional Stakeholder Shares of Resource Expense.
Figure 32. Proportional Stakeholder Shares of Facilities Resource Expense.
Figure 33. Proportional Stakeholder Shares of Personnel Expense.
Figure 34. Proportional Stakeholder Shares of Equipment Expense.
Figure 35. Proportional Stakeholder Shares of Supply Expense.
Figure 36. Proportional Stakeholder Shares of Other Expenses.