Download
1 / 1
10 likes | 293 Views
Heating and Cooling in Cooling Flows Fabrizio Brighenti, Dipartimento di Astronomia, Universita’ di Bologna William G. Mathews, UCO/Lick, Board of Studies in Astronomy and Astrophysics, University of California, Santa Cruz. Introduction

E N D
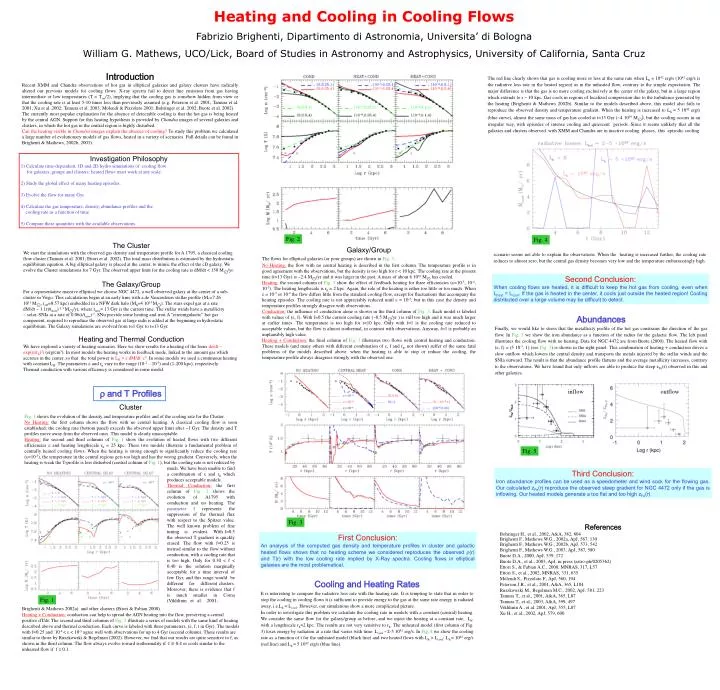
Heating and Cooling in Cooling Flows Fabrizio Brighenti, Dipartimento di Astronomia, Universita’ di Bologna William G. Mathews, UCO/Lick, Board of Studies in Astronomy and Astrophysics, University of California, Santa Cruz Introduction Recent XMM and Chandra observations of hot gas in elliptical galaxies and galaxy clusters have radically altered our previous models for cooling flows. X-ray spectra fail to detect line emission from gas having intermediate or low temperatures (T < Tvir/2), implying that the cooling gas is somehow hidden from view or that the cooling rate is at least 5-10 times less than previously assumed (e.g. Peterson et al. 2001; Tamura et al. 2001; Xu et al. 2002; Tamura et al. 2003; Molendi & Pizzolato 2001; Bohringer et al. 2002; Buote et al. 2002). The currently most popular explanation for the absence of detectable cooling is that the hot gas is being heated by the central AGN. Support for this heating hypothesis is provided by Chandra images of several galaxies and clusters, in which the hot gas in the central region is highly disturbed. Can the heating visible in Chandra images explain the absence of cooling? To study this problem we calculated a large number of evolutionary models of gas flows, heated in a variety of scenarios. Full details can be found in Brighenti & Mathews, 2002b, 2003). The red line clearly shows that gas is cooling more or less at the same rate when Lh = 1042 erg/s (1042 erg/s is the radiative loss rate in the heated region) as in the unheated flow, contrary to the simple expectation. The major difference is that the gas is no more cooling exclusively at the center of the galaxy, but in a large region which extends to r ~ 10 kpc. Gas cools in regions of localized compression due to the turbulence generated by the heating (Brighenti & Mathews 2002b). Similar to the models described above, this model also fails to reproduce the observed density and temperature gradient. When the heating is increased to Lh = 5 1042 erg/s (blue curve), almost the same mass of gas has cooled at t=13 Gyr (~4 1010M⊙), but the cooling occurs in an irregular way, with episodes of intense cooling and quiescent periods. Since it seems unlikely that all the galaxies and clusters observed with XMM and Chandra are in inactive cooling phases, this episodic cooling Investigation Philosophy 1) Calculate time-dependent, 1D and 2D hydro simulations of cooling flow for galaxies, groups and clusters: heated flows must work at any scale. 2) Study the global effect of many heating episodes. 3) Evolve the flow for many Gyr. 4) Calculate the gas temperature, density, abundance profiles and the cooling rate as a function of time. 5) Compare these quantities with the available observations. Fig. 2 Fig. 4 The Cluster We start the simulations with the observed gas density and temperature profile for A 1795, a classical cooling flow cluster (Tamura et al. 2001; Ettori et al. 2002). The total mass distribution is estimated by the hydrostatic equilibrium equation. A big elliptical galaxy is placed at the center, to mimic the effect of the cD galaxy. We evolve the Cluster simulations for 7 Gyr. The observed upper limit for the cooling rate is dM/dt < 150 M⊙/yr. The Galaxy/Group For a representative massive elliptical we choose NGC 4472, a well observed galaxy at the center of a sub- cluster in Virgo. This calculations begin at an early time with a de Vaucouleurs stellar profile (M*=7.26 1011 M⊙, reff=8.57 kpc) embedded in a NFW dark halo (Mh=4 1013 M⊙). The stars expel gas at a rate dM/dt ~ 1.1(t/tnow)-1.3 M⊙/yr, where tnow= 13 Gyr is the current time. The stellar winds have a metallicity ~ solar. SNIa at a rate of 0.06(t/tnow)-1. SNu provide some heating and iron.A “circumgalactic” hot gas component, required to reproduce the observed gas at large radii is added at the beginning in hydrostatic equilibrium. The Galaxy simulations are evolved from t=1 Gyr to t=13 Gyr. Heating and Thermal Conduction We have explored a variety of heating scenarios. Here we show results for a heating of the formde/dt ~ exp((r/rh)2) (erg/cm3). In most models the heating works in feedback mode, linked to the amount gas which accretes in the center, so that the total power is LH = e dM/dt c2. In some models we used a continuous heating with constant LH. The parameters e and rh vary in the range (10-2 – 10-5) and (1-200 kpc), respectively. Thermal conduction with various efficiency is considered in some model. Galaxy/Group The flows for elliptical galaxies (or poor groups) are shown in Fig. 3. No Heating: the flow with no central heating is described in the first column. The temperature profile is in good agreement with the observations, but the density is too high for r < 10 kpc. The cooling rate at the present time (t=13 Gyr) is ~2.4 M⊙/yr and it was larger in the past. A mass of about 6 1010M⊙ has cooled. Heating: the second column of Fig. 3 show the effect of feedback heating for three efficiencies (e=10-5, 10-4, 10-3). The heating lengthscale is rh = 2 kpc. Again, the role of the heating is either too little or too much. When e = 10-5 or 10-4 the flow differs little from the standard cooling flow, except for fluctuations that accompany the heating episodes. The cooling rate is not appreciably reduced until e = 10-3, but in this case the density and temperature profiles strongly disagree with observations. Conduction: the influence of conduction alone is shown in the third column of Fig. 3. Each model is labeled with values of (e, f). With f=0.5 the current cooling rate (~0.5 M⊙/yr ) is still too high and it was much larger at earlier times. The temperature is too high for r<10 kpc. Only with f=1 is the cooling rate reduced to acceptable values, but the flow is almost isothermal, in contrast with observations. Anyway, f=1 is probably an unplausibly high value. Heating + Conduction: the final column of Fig. 3 illustrates two flows with central heating and conduction. These models (and many others with different combination of e, f and rh, not shown) suffer of the same fatal problems of the models described above: when the heating is able to stop or reduce the cooling, the temperature profile always disagrees strongly with the observed one. scenario seems not able to explain the observations. When the heating is increased further, the cooling rate reduces to almost zero, but the central gas density becomes very low and the temperature embarrassingly high. Second Conclusion: When cooling flows are heated, it is difficult to keep the hot gas from cooling, even when Lheat = Lcool. If the gas is heated in the center, it cools just outside the heated region! Cooling distributed over a large volume may be difficult to detect. Abundances Finally, we would like to stress that the metallicity profile of the hot gas constrains the direction of the gas flow. In Fig. 5 we show the iron abundance as a function of the radius for the galactic flow. The left panel illustrates the cooling flow with no heating. Data for NGC 4472 are from Buote (2000). The heated flow with (e, f) = (5 10-3, 1) (see Fig. 3) is shown in the right panel. This combination of heating + conduction drives a slow outflow which lowers the central density and transports the metals injected by the stellar winds and the SNIa outward. The result is that the abundance profile flattens and the average metallicity increases, contrary to the observations. We have found that only inflows are able to produce the steep zFe(r) observed in this and other galaxies. rand T Profiles Cluster Fig. 1 shows the evolution of the density and temperature profiles and of the cooling rate for the Cluster. No Heating: the first column shows the flow with no central heating. A classical cooling flow is soon established; the cooling rate (bottom panel) exceeds the observed upper limit after ~1 Gyr. The density and T profiles move away from the observed ones. This model is clearly unacceptable. Heating: the second and third columns of Fig. 1 show the evolution of heated flows with two different efficiencies e and heating lengthscale rh = 25 kpc. These two models illustrate a fundamental problem of centrally heated cooling flows. When the heating is strong enough to significantly reduce the cooling rate (e=10-3), the temperature in the central regions gets too high and has the wrong gradient. Conversely, when the heating is weak the T-profile is less disturbed (central column of Fig. 1), but the cooling rate is not reduced by inflow outflow Fig. 5 much. We have been unable to find a combination of e and rh which produces acceptable models. Thermal Conduction:the first column of Fig. 2 shows the evolution of A1795 with conduction and no heating. The parameter f represents the suppression of the thermal flux with respect to the Spitzer value. The well known problem of fine tuning is evident. With f=0.5 the observed T gradient is quickly erased. The flow with f=0.25 is instead similar to the flow without conduction, with a cooling rate that is too high. Only for 0.30 < f < 0.40 is the solution marginally acceptable for a time interval of few Gyr, and this range would be different for different clusters. Moreover, there is evidence that f is much smaller in Coma (Vikhlinin et al. 2001; Third Conclusion: Iron abundance profiles can be used as a speedometer and wind sock for the flowing gas. Our calculated zFe(r)reproduce the observed steep gradient for NGC 4472 only if the gas is inflowing. Our heated models generate a too flat and too high zFe(r). Fig. 3 References Bohringer H., et al., 2002, A&A, 382, 804 Brighenti F., Mathews W.G., 2002a, ApJ, 567, 130 Brighenti F., Mathews W.G., 2002b, ApJ, 573, 542 Brighenti F., Mathews W.G., 2003, ApJ, 587, 580 Buote D.A., 2000, ApJ, 539, 172 Buote D.A., et al., 2003, ApJ, in press (astro-ph/0205362) Ettori S., & Fabian A.C., 2000, MNRAS, 317, L57 Ettori S., et al., 2002, MNRAS, 331, 635 Molendi S., Pizzolato F., ApJ, 560, 194 Peterson J.R., et al., 2001, A&A, 365, L104 Ruszkowski M., Begelman M.C., 2002, ApJ, 581, 223 Tamura T., et al., 2001, A&A, 365, L87 Tamura T., et al., 2003, A&A, 399, 497 Vikhlinin A., et al. 2001, ApJ, 555, L87 Xu H., et al., 2002, ApJ, 579, 600 First Conclusion: An analysis of the computed gas density and temperature profiles in cluster and galactic heated flows shows that no heating scheme we considered reproduces the observed r(r) and T(r) with the low cooling rate implied by X-Ray spectra. Cooling flows in elliptical galaxies are the most problematical. Cooling and Heating Rates It is interesting to compare the radiative loss rate with the heating rate. It is tempting to state that in order to stop the cooling in cooling flows it is sufficient to provide energy to the gas at the same rate energy is radiated away, i.e.Lh = Lcool. However, our simulations show a more complicated picture. In order to investigate this problem we calculate the cooling rate in models with a constant (central) heating. We consider the same flow for the galaxy/group as before, and we inject the heating at a constant rate, Lh, with a lengthscale rh=2 kpc. The results are not very sensitive to rh. The unheated model (first column of Fig. 3) loses energy by radiation at a rate that varies with time: Lcool ~2-5 1042 erg/s. In Fig. 4 we show the cooling rate as a function of t for the unheated model (black line) and two heated flows with Lh > Lcool: Lh = 1042 erg/s (red line) and Lh = 5 1042 erg/s (blue line). Fig. 1 Brighenti & Mathews 2002a) and other clusters (Ettori & Fabian 2000). Heating + Conduction: conduction can help to spread the AGN heating into the flow, preserving a central positive dT/dr. The second and third columns of Fig. 2 illustrate a series of models with the same kind of heating described above and thermal conduction. Each curve is labeled with three parameters, (e, f, t in Gyr). The models with f=0.25 and 10-4 < e < 10-3 agree well with observations for up to 4 Gyr (second column). These results are similar to those by Ruszkowski & Begelman (2002). However, we find that our results are quite sensitive to f, as shown in the third column. The flow always evolve toward isothermality if f ≳ 0.4 or cools similar to the unheated flow if f 0.1.