Download
1 / 1
10 likes | 82 Views
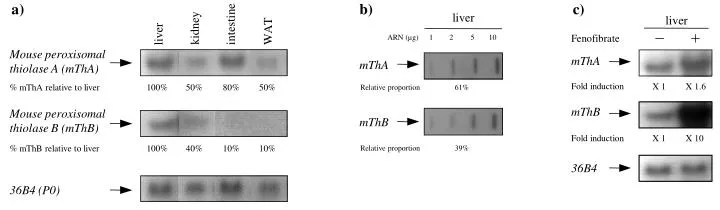
a). b). c. ). liver. l. iver. intestine. kidney. WAT. liver. Fenofibrate. ARN (µg). 1. 2. 5. 10. Mouse peroxisomal. mThA. mThA. thiolase A (mThA). Fold induction. X 1. X 1.6. % mThA relative to liver. 1. 00%. 50%. 80%. 50%. Relative proportion. 61%. mThB.

E N D
a) b) c ) liver l iver intestine kidney WAT liver Fenofibrate ARN (µg) 1 2 5 10 Mouse peroxisomal mThA mThA thiolase A (mThA) Fold induction X 1 X 1.6 % mThA relative to liver 1 00% 50% 80% 50% Relative proportion 61% mThB Mouse peroxisomal mThB thiolase B (mThB) Fold induction X 1 X 10 % mThB relative to liver 100% 40% 10% 10% Relative proportion 39% 36B4 36B4 (P0)