Download
1 / 59
690 likes | 1.1k Views
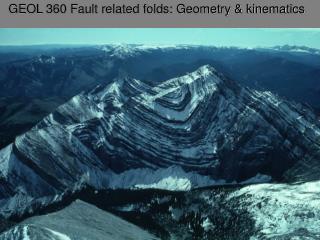
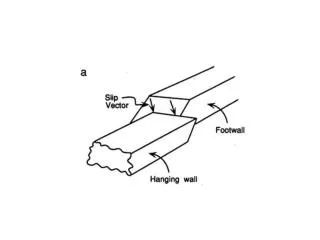
EXTENSIONAL FAULT GEOMETRY AND EVOLUTION. Predict flow patterns and communication Fault compartments in the Sleipner field, Norwegian North Sea Different oil-water contacts. Ottesen Ellevset et al . (1998). Fault Properties. Fault Length (strike) Fault Throw : Height (Dip)

E N D
Predict flow patterns and communicationFault compartments in the Sleipner field, Norwegian North SeaDifferent oil-water contacts Ottesen Ellevset et al. (1998)
Fault Properties • Fault Length (strike) • Fault Throw : Height (Dip) • Fault Segmentation and Linkage. • Fault Zone Geometry (individual fault scale) • Fault Array Geometry (area / basin scale) • Fault Activity
Skua field in Timor Sea, NW Australia Footwall high Systematic heave polygon shape Taper from zero width at fault tips (low or zero fault displacement) to a maximum width near the fault center. Maximum uplift near center of fault. Osborne (1990) SINGLE FAULTS
Footwall anticline: Cross-section A-A’ shows form of footwall anticline. Maximum uplift near center of fault. Hangingwall syncline: Maximum structural low near center of fault. Beatrice Field, N. Sea Map view Transverse section through hanging wall SINGLE FAULTS Schlische, 1995
1km Structure contours around an isolated normal fault
Throw and Separation. Maximum separation (throw) near center of fault. Gradual taper of separation profile from a maximum separation to zero at the fault tips. Single fault from surface exposure in central Oregon SINGLE FAULTS: Displacement
Contours on fault surface of separation measured from 5 horizons intersecting the fault. Separation varies across fault surface like that on an individual horizon: the maximum separation occurs near the center of the fault. SINGLE FAULTS: Displacement Gulf Coast normal fault
SINGLE FAULTS: Displacement • Contours of throw projected onto fault surface. • Elliptical fault shape most common for buried faults.
SINGLE FAULTS: Displacement • Similar displacement profiles along dip and strike profiles. • Homogeneous, isotropic material Higgs and Williams, 1987
IsolatedNorth Sea fault Throw increases with depth but only upper part of fault mapped
Fault dimensions 1:1 3:1 From Nicol et al. (1996)
Fault dimensions • Aspect ratios average 2:1 but variable • Linear throw gradients on isolated faults • Non-linear on restricted faults • Steeper gradients near overlapping tips
Fault aspect ratios From Nicol et al. (1996)
Deformation around a fault • Reverse ‘drag’ profiles generate: • footwall uplift • hangingwall subsidence • Relationship of structure contours to fault vary with slip direction • Reverse drag does not imply a listric fault • Earthquake related elastic strains relax to permanent bed deformation
Reverse Drag Cross-section Schlische, 1995 • Displacement (structural relief) decreases asymptotically away from fault in cross-section. • Footwall high and Hangingwall low.
Earthquake induced deformation < Imperial Valley earthquake 1940 Slip = e-3.5dist – 0.03dist Strike-slip illustrates offsets Strike-slip Normal Borah Peak earthquake 1983 > Lost River fault, Idaho
Deformation around a fault Radar interferometry image of ground deformation induced by Hector Mine earthquake Peltzer et al. http://www-radar.jpl.nasa.gov/sect323/InSar4crust/HME/
Fault drag profiles Empirical relationships for: Single event: Slip = e-3.5dist – 0.03dist Multiple event steady state: Slip = e-5.5dist – 0.004dist From Gibson et al. (1989)
Hangingwall & footwall displacement • Same in hangingwall and footwall for blind faults • Greater hangingwall subsidence than footwall uplift for synsedimentary faults • Percentage contribution of hangingwall displacement (HW) is given by: HW = 110 – 2q/3 Where q is fault dip and dip exceeds 30 degrees
The Craven fault zone Patterns around synsedimentary faults:a local example
Normal drag in footwall to a 6m throw normal fault Normal drag profiles often highly localised around fault
SINGLE FAULTS • Displacement Summary: • Maximum separation near center of fault. • Uniform displacement contour distribution on fault surface. • Multiple horizons cut by a single fault: • greater separation on horizons near center of fault. • similar separation profile shape. • In section, the fault drag decreases gradually away from fault trace.
Schlische, 1995 MULTIPLE FAULTS En-echelon Normal Faults. Faults interact and influence deformation of adjacent faults.
MULTIPLE FAULTS Fault overlap in map view and section view. Peacock and Sanderson (1991)
Flamborough Head, UK Peacock and Zhang, 1993 MULTIPLE FAULTS Mechanical Stratigraphy: outcrop • Fault tip overlap in cross-section.
RHOB-NPHI 1 2 H2b 3 4b Vertical Segmentation Seismic Interpretation. Faults nucleate in more brittle sandstones. From Rives & Benedicto 2000
Structure map relay Fault traces relay Relays mechanically interconnect to form longer fault. Geometric Coherence • Multiple faults act as a composite zone. • Displacement on composite faults creates broad footwall uplift. • Separate fault segments compartmentalize the trap. • Systematic throw variation. • Composite throw summed like a single fault.
Displacement pattern – correlated single fault 2D-seismic data set – Middle East
Displacement pattern – correlated multiple faults 2D-seismic data set – Middle East
Displacement patterns on overlapping faults from Childs et al. (1995)
Geometric coherence B A Relay ramp structure and displacement patterns on overlapping faults. Summed throws give a coherent pattern. From Huggins et al. (1995)
MULTIPLE FAULTS Throw profiles for main fault segments Segmented Fault Array Nook Colliery, Lancashire Summed throws on fault segments • Low gradients at fault zone terminations. • Large gradients in fault overlap. • Summed profile resembles single fault. • Maximum throw near composite fault center. Walsh and Watterson (1990)
Exercise • Longbranch fault interpretation
FAULT 1 FAULT 2 Strike Projection of Throw • Asymmetric throw distribution. • Throw gradient greatest in region of overlap. Fault traces: Map Separation Diagram FAULT 2 Composite Fault Throw FAULT 1 • Symmetric throw distribution. • Possible breached relay at arrow: hard link. Displacement Variation Childs et al., 1995 Fault Throw Distributions: Northern N. Sea.
Cross-Section Splay Splay included Splay excluded Cross-section tie Strike Projection Geometric Coherence Distinct anomaly in throw contours without splay. Walsh and Watterson, 1991
Fault laterally restricted Presence of deep shaded fault restricts propagation of contoured fault. MULTIPLE FAULTS: Nicol et al., 1995