Download
1 / 33
330 likes | 472 Views
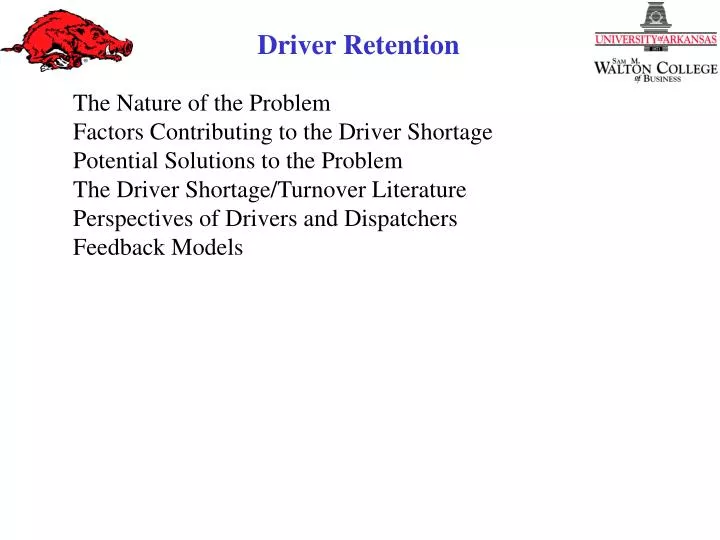
The Nature of the Problem Factors Contributing to the Driver Shortage Potential Solutions to the Problem The Driver Shortage/Turnover Literature Perspectives of Drivers and Dispatchers Feedback Models . The Nature of the Problem

E N D
The Nature of the Problem Factors Contributing to the Driver Shortage Potential Solutions to the Problem The Driver Shortage/Turnover Literature Perspectives of Drivers and Dispatchers Feedback Models
The Nature of the Problem Turnover has Been Approximately 100% for the TL Segment of the Trucking Industry Since the Mid-1980s Lost Freight Revenue from Vehicles Sitting Idle The Cost of Driver Replacement is Estimate to be between $5,000 and $12,000 (Probably close to $10,000) Cost to the Industry is in the Billions
Factors Contributing to the Driver Shortage Changing demographics Failure to recruit women and minorities Inadequate pay and poor working conditions (long times away from home) The Motor Vehicle Safety Act of 1986
Potential Solutions to the Problem Actively recruiting Women, Blacks, and Hispanics. Developing closer relations with high schools and vocational schools. Creating internal career ladders for future drivers. Placing more emphasis on scheduling techniques that permit drivers to return to their home towns as frequently as possible. Placing more emphasis on keeping equipment in good condition since this has been found to be an important incentive to drivers. Cooperative driver training programs that provide free training with commitments to drive for specified times after completion of training. Developing proactive driver recruiting policies; i.e., on-going programs with active files on interested and qualified drivers. Increasing Driver Pay
Pre-employment Screening Applications Interviews Written Tests Road Tests Driving Record Background Investigation DOT Physical
Driving and Background Checks Outside Services (i.e., DAC Services, Tulsa, OK) Computerized Access to State MVR Databases 24 to 48 Hour Turnaround Driver Work History More than 2,500 Trucking Companies
Recommendations Look for People Who See the Job as More than Just Driving Drivers Should Reflect the Image of the Firm Drivers are and Extension of the Sales Force Don't Take Shortcuts to Hiring Never Lower Your Expectations Attempt to Hire People for Life Verify the Information on the Application Document Everything
The Turnover Literature Shortage and Recruitment Target Non-Traditional (LeMay and Taylor 1988) Recruiting Techniques (Southern Rakowski, and Godwin 1989) (Dobie, Rakowski, and Southern, 1998) Driver Characteristics (Beilock and Capelle, 1990) Retaining Drivers Incentives for Performance (Taylor, 1991) Firm Attributes Leading to Retention (LeMay, Taylor, and Turner, 1994) Driver Satisfaction (Richard, LeMay, Taylor, and Turner, 1994); Attitudes Toward Management (Richard, LeMay, Taylor, 1995) Focus on Dispatchers (Keller and Ozment, 1999)
Results of Exit Interviews • Reasons Drivers Leave • Poor Pay • Too Much Time Away from Home • Other (Approximately 35 %; 20 % related to Dispatcher) • Other Reasons Drivers Leave • Dispatchers don’t answer messages • No praise for doing a good job • Lack of communication • Dishonest dispatcher • No answer from dispatcher in two months • Didn’t want to change dispatchers • Dissatisfied with performance review
Results of Exit Interviews (Continued) • Reasons Drivers Leave (besides pay & time away from home) • Wanted a transfer • Poor treatment by the company • Unfair operations policies • Settlement Problems • Trouble with night dispatcher • Dispatcher incompetent decision maker • Unhappy with dispatcher • Problems with dispatcher switchboard • Unhappy with changes in runs • Poor treatment by customers
Results of Focus Groups: Perspectives of Drivers and Dispatchers Group Question: What are the Most Important Things that a Dispatcher Can Do to Help Retain Drivers? Top Five Answers: 1. Routing Home 2. Better Communication 3. Positive and Personable Attitudes 4. Provide Miles 5. Maintain Trustworthiness
Results of Focus Groups: Perspectives of Drivers and Dispatchers • Other Issues • Drivers Report Little Interest in Using: • 1-(800) Hot Lines • Comment Cards • Suggestion Boxes • Open Door Policies • Driver Preferences: • Quick and Easy Feedback Methods • Easily Accessible Communication Tools • No Required Writing
Research Question How can a dispatcher increase the productivity of the drivers and keep them satisfied enough to remain with the company? Why is one dispatcher better at this than another?
Exit, Voice and Loyalty (Hirshman, 1970) • “When organizations that are largely exit-sensitive encounter voice, it leads to little change in the output of the organization. Voice will either be ignored or institutionalized.” • (Matland, 1995)
Exit, Voice and Loyalty Supports the Notion of Employees as Internal Customers Characterizes Alternative Reactions to Dysfunctional Behaviors of Firms Characterizes Alternative Responses of Firms
A Model of Dispatcher Sensitivity, Responsiveness, and Driver Turnover S-Voice Turnover Responsiveness S-Exit
Results Voice is Institutionalized in Many (Most) Trucking Companies Dispatchers Who are Sensitive to Voice and Who Respond to Voice have Significantly Higher Retention Rates than Other Dispatchers Sensitivity to Exit Leads to Few Changes in the Firm
Feedback Models CBF Models - Complaint-Based Feedback Models PBF Models - Period-Based Feedback Models Combined PBF and CBF Models (Periodic Feedback of Complaints)
CBF Models - Complaint-Based Feedback Models Complaining Behavior Immediate Problems Poor Service Hotels Restaurants Police Departments, etc., etc.
PBF Models - Period-Based Feedback Models Quarterly Job Reviews Teacher Evaluations Wal-Mart Shrinkage ATCR – Air Travel Consumer Report Holiday Inn
PBF Models - Period-Based Feedback Models Quarterly Job Reviews Teacher Evaluations Wal-Mart Shrinkage ATCR – Air Travel Consumer Report Holiday Inn
PBF Models - Period-Based Feedback Models ATCR – Air Travel Consumer Report Table 1: Overall Percentage of Reported Flight Operations Arriving On Time, by Carrier Table 1A: Overall Percentage of Reported Flight Operations Arriving On Time and Carrier Rank, by Month, Quarter, and Data Base to Date Table 2: Number of Reported Flight Arrivals and Percentage Arriving On Time, by Carrier and Airport Table 3: Percentage of All Carriers' Reported Flight Operations Arriving On Time, by Airport and Time of Day Table 4: Percentage of All Carriers' Reported Flight Operations Departing On Time, by Airport and Time of Day Table 5: List of Regularly Scheduled Flights Arriving Late 80% of the Time or More Table 6: Number and Percentage of Regularly Scheduled Flights Arriving Late 70% of the Time or More Table 7: On-Time Arrival and Departure Percentage, by Airport Table 8: Overall Number and Percentage of Flight Cancellations, by Carrier Table 9: Flight Causation Data, By Airline and Category Table 10: Flight Causation Data, Graphic Representation
PBF Models - Period-Based Feedback Models ATCR – Air Travel Consumer Report Mishandled Baggage Explanation Ranking—Month Oversales Explanation Ranking—2ndQtr Ranking—January-June 2008 Consumer Complaints (Feedback to the public periodic) Explanation Complaint Tables 1-5 Summary, Complaint Categories, U.S. Airlines, Incident Date, and Companies Other Than U.S. Airlines Rankings, Table 6 (Month) Complaint Categories
PBF Models - Period-Based Feedback Models Quarterly Job Reviews Teacher Evaluations Wal-Mart Shrinkage ATCR – Air Travel Consumer Report Holiday Inn
Combining PBF and CBF Models (Periodic Feedback of Complaints) ATCR – Air Travel Consumer Report Holiday Inn Drivers
Combining PBF and CBF Models (Periodic Feedback of Complaints) ATCR – Air Travel Consumer Report Holiday Inn Drivers
PBF/CBF Model Driver-Dispatcher Communication Model Area Manager Fleet Manager 1 Fleet Manager 2 Fleet Manager 3 Fleet Manager 4 Fleet Manager 5 Fleet Manager 6 Fleet Manager 7 Etc., Etc., Etc. Driver 1 Driver 2 Driver 3 Driver 4 Driver 5 Driver 6 Driver 7 Etc., Etc., Etc.
PBF/CBF Model Driver-Dispatcher Communication Model Area Manager Computer Fleet Manager Driver
PBF/CBF Model Driver-Dispatcher Communication Model Complaint Area 1 Provides Miles Complaint Area 2 Gets Me Home Often Complaint Area 3 Helpful with Problems Complaint Area 4 Respectful Complaint Area 5 Fair Complaint Area 6 Honest
PBF/CBF Model Driver-Dispatcher Communication Model Complaints Fleet Mgr 1 Mean Provides Miles 6 8 Gets Me Home Often 7 12 Helpful with Problems 6 15 Respectful 5 7 Fair 11 15 Honest 8 15
PBF/CBF Model Driver-Dispatcher Communication Model Complaints Fleet Mgr 2 Mean Provides Miles 7 8 Gets Me Home Often 9 12 Helpful with Problems 18 15 Respectful 4 5 Fair 12 15 Honest 10 15
PBF/CBF Model Driver-Dispatcher Communication Model Complaints Fleet Mgr 3 Mean Provides Miles 10 8 Gets Me Home Often 17 12 Helpful with Problems 20 15 Respectful 12 5 Fair 21 15 Honest 17 15