Download

1 / 38
380 likes | 435 Views
This instructional program covers the basics of Visual Basic Programming, focusing on defining and constructing program flowcharts with different control structures. Learn to create simple Visual Basic applications and understand the features of flowcharts in program logic formulation. Enhance your coding skills by exploring sequence, selection, and iteration logic. Dive into variable declarations, assignment statements, and more to develop your programming proficiency in Visual Basic.

E N D
Visual Basic Programming FLOWCHART Construction CODING
OBJECTIVES: • Define the three control structures clearly; • Construct program flowcharts and source codes that portray different control structures; and • Appreciate the features of flowchart as a tool in program logic formulation.
CONTROL STRUCTURE controls the logical sequence in which computer program instructions are executed. Also known as Logic Structure 3 TYPES: SEQUENCE SELECTION ITERATION
What is Sequence Logic ? • instructions are executed in order, from top to bottom. • No decisions to make, no choices between “yes or no”
Sample Problem 1: Make a program that will solve for the grade of a student in Computer III using the following: Quizzes 20% CS 15% Lab 30% PT 35% SEQUENCE
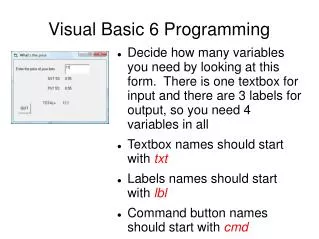
Steps in Creating Simple VB Applications Create the User Interface (GUI) Set the Properties of the Objects Enter the appropriate Source Code Run the Program
Elements of a GUI Control • Property • characteristics or parameters of a control • Event • an action or occurrence to which a program responds • Method • function of the control
Variables • Variable – a named memory location capable of storing values based on its definition • Numeric: used to store a value which is numeric in nature • String: used for storing strings **Variable Conventions
Data Types • Data Type – an element of a variable that verifies the kind of data it can store. - Boolean - Short - Integer (9) - Long (17) - Single - Double - String
Variable Declarations SYNTAX: Dim <variablename> as <data type> OR: Dim <variablename><suffix> Suffixes: Integer ( % ) Double ( # ) Single ( ! ) Long ( & ) String ( $ )
Sample Variable Declarations Ex 1. X and Y are of integer data type. Dim X as integer Dim Y% Ex 2. Name is of string data type. Dim Name$
The Assignment Statement(INPUT) SYNTAX: Variable =ObjectName.PropertyName WHERE: ObjectName – name of the control PropertyName – property of the control Variable - variable / identifier Ex: Name = txtSN.Text
The Assignment Statement(OUTPUT) SYNTAX: ObjectName.PropertyName = Value WHERE: ObjectName – name of the control PropertyName – property of the control Value - a constant or a variable Ex: lblDisplay.text = “Hello!”
Sample Problem 2 and 3: Construct a flowchart that will solve for the Area and Perimeter of a rectangle. A program that accepts 2 numbers, solve for the sum, difference, quotient and product of the entered numbers. SEQUENCE
What is Selection Logic? • A structure that represents a choice. • Enables the computer to make decisions based on a given set of choices
SELECTION LOGIC 2 TYPES: Single Single Alternative Double Alternatives Compound Multiple Alternatives
refers to an operation that is carried out on variables that can only have two possible values: TRUE and FALSE uses relational and / or logical operators BOOLEAN Expression
RELATIONAL OPERATORS > >= = <= <> <
LOGICAL OPERATORS NOT AND XOR OR
Sample Problem 1: Make a program that will solve for the grade of a student in Computer III using the following: Quizzes 20% CS 15% Lab 30% PT 35% Determine whether the grade is passing or failing SELECTION
Write a program that will assist a teacher in calculating student’s grade at the end of the grading period. The program will accept a numerical grade as input, then it will display the character grade as output based on the given scale: 90 and above A 80 – 89 B 70 – 79 C 69 and below D EXERCISE 1 (Seatwork Size 2 CW)
Guidelines in Constructing Flowcharts 1. Flowchart symbols represent various operations 2. A flowchart starts with BEGIN / START and is completed by END / STOP. 3. Flow lines interconnect symbols. 4. The arrowhead of a flow line indicates the direction to be followed. It is optional when the flow is from top to bottom or from left to right
Guidelines in Constructing Flowcharts 5. The sequence of symbols is important. It indicates the step-by-step logic to follow. • The terminal, Input/Output, Process and connector symbols must have only one arrow branching out, but may have more than one arrow branching in. • The decision symbol must have two exit points (True/Yes and False/No).
Guidelines in Constructing Flowcharts 8. Use connector symbols to reduce the number of flow lines. Avoid intersecting flow lines to make it more effective and easier to follow. • There may be varied flowcharts to solve one problem. There is no ONE correct flowchart. • It is always useful to test the validity of the flowchart by passing through it with a simple test data.
What is Iteration Logic? • involves loops or cycles • there are two types: • WHILE • DO UNTIL • Provides a means of repeating a part of instruction without rewriting the part again and again
Two Parts of Iteration Structure • Body of the Loop • Set of instructions which are repeated • Loop-Exit Condition • Condition to be tested before each repetition
The loop-exit condition is placed at the beginning of the loop WHILE it is not yet the end-of-file, read and process student records The exit from the loop is done at the end of the loop DO read and process student records UNTIL it is already the end-of-file WHILE / DO UNTIL
No Condition Yes Procedure (body of the loop) WHILE Structure:
Procedure (Body of Loop) No Condition Yes DO UNTIL Structure:
COUNTER **Counter Used to literally count the number of times a portion of the flowchart is traced. Format: CT = CT + 1 Where CT is any variable + = CT CT 1 New Value Current Value Increment Value
Accumulator A numeric variable which collects the results of a repeated mathematical operation Used to keep a running total of an item. Format:S = S + N ** SUM = SUM + N ** TotalScore = TotalScore + Score
ITERATION • Make a program that will compute for the total score of all students in III – 1 in Quiz #1. Print the result. • Construct the flowchart