Download
1 / 28
280 likes | 295 Views
Learn how to find the median, mode, and range of a dataset. Examples and practice questions included for better understanding. Master key statistical concepts easily.

E N D
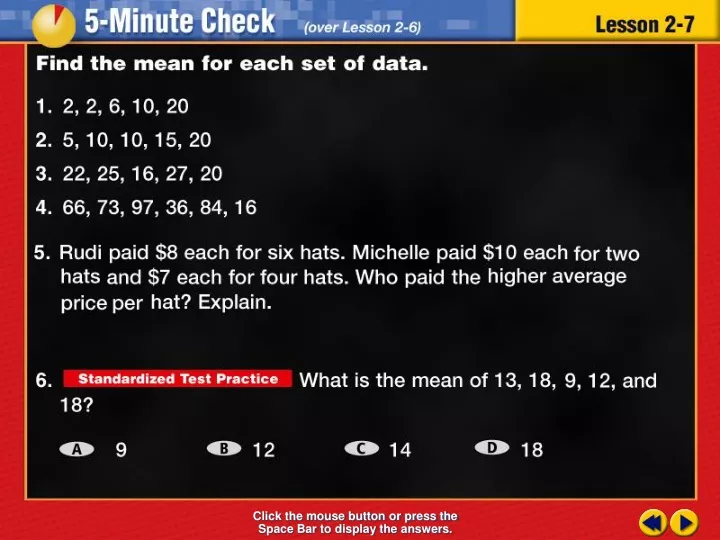
Transparency 7 Click the mouse button or press the Space Bar to display the answers.
Example 7-4b Objective Find the median, mode, and range of a set of data
Example 7-4b Vocabulary Median The middle number of an ordered set (odd set of data) Or The mean of the middle two numbers of an ordered set (even set of data)
Example 7-4b Vocabulary Mode The number(s) that occur most often
Example 7-4b Vocabulary Range The difference between the greatest and the least value of the set
Lesson 7 Contents Example 1Find Median and Mode Example 2Find Mean, Median, and Mode Example 3Use Mean, Median, and Mode Example 4Find Range
Example 7-1a NUTRITION The table shows the Calorie content of various vegetables. Find the median and mode of the data. Order data from least to greatest 5, 15, 15, 20, 25, 25, 31, 35, 40, 50, 55, 85 1/4
median: 28 Example 7-1b 5, 15, 15, 20, 25, 25, 31, 35, 40, 50, 55, 85 Count the pieces of data and divide by 2 12 divided by 2 = 6 Beginning at smallest number, underline 6 pieces of data Beginning at largest number, underline 6 pieces of data Circle the 2 middle numbers Find the mean of the numbers Add numbers and divide by 2 1/4
Example 7-1b NUTRITION The table shows the Calorie content of various vegetables. Find the median and mode of the data. Use the numbers ordered from least to greatest 5, 15, 15, 20, 25, 25, 31, 35, 40, 50, 55, 85 There are 2 modes: 15 and 25 Answer: median = 28 mode = 15 and 25 1/4
Example 7-1c COLLEGE The table shows the ages of students in a science class at a local community college. Find the median and mode of the data. Answer: Median = 19.5 Mode = 19 1/4
Example 7-2a MULTIPLE-CHOICE TEST ITEM What are the mean, median, and mode of the age survey data 24, 30, 38, 33, 19, and 24, respectively? A 24, 24, 24 B 26, 54, 24 C 27, 28, 24 D 28, 27, 24 Read the Test ItemYou need to find the mean, median, and mode of the data. 2/4
Example 7-2b Mean MULTIPLE-CHOICE TEST ITEM What are the mean, median, and mode of the age survey data 24, 30, 38, 33, 19, and 24, respectively? Put data in numerator Mean = sum of data pieces of data Count number of data and put in denominator Mean = 24 + 30 + 38 + 33 + 19 + 24 6 Add numerator Mean = 168 Bring down 6 6 2/4
Example 7-2b Mean MULTIPLE-CHOICE TEST ITEM What are the mean, median, and mode of the age survey data 24, 30, 38, 33, 19, and 24, respectively? Divide numerator by denominator Mean = 168 6 Mean = 28 2/4
Example 7-2b Median MULTIPLE-CHOICE TEST ITEM What are the mean, median, and mode of the age survey data 24, 30, 38, 33, 19, and 24, respectively? Order numbers from least to greatest 19, 24, 24, 30, 33, 38 Count the pieces of data and divide by 2 6 divided by 2 = 3 Beginning at smallest number, underline 3 pieces of data Beginning at largest number, underline 3 pieces of data Circle the 2 middle numbers 2/4
Example 7-2b Median MULTIPLE-CHOICE TEST ITEM What are the mean, median, and mode of the age survey data 24, 30, 38, 33, 19, and 24, respectively? 19, 24, 24, 30, 33, 38 Find the mean of the numbers Add numerators Median = 24 + 30 Bring down the 2 2 Median = 54 Divide numerator by denominator 2 Median = 27 2/4
Example 7-2b Mode MULTIPLE-CHOICE TEST ITEM What are the mean, median, and mode of the age survey data 24, 30, 38, 33, 19, and 24, respectively? 19, 24, 24, 30, 33, 38 Use the numbers listed from least to greatest Look for numbers that occur most often Mode = 24 24 is the only number that occurs more than once 2/4
Example 7-2b MULTIPLE-CHOICE TEST ITEM What are the mean, median, and mode of the age survey data 24, 30, 38, 33, 19, and 24, respectively? A 24, 24, 24 B 26, 54, 24 C 27, 28, 24 D 28, 27, 24 The mean = 28, the median = 27, and the mode = 24. Choose the letter that best represents the answer Answer: D 2/4
Example 7-2c MULTIPLE-CHOICE TEST ITEM What are the mean, median, and mode of the quiz score data 18, 14, 16, 18, and 19, respectively? A 15, 18, 18 B 17, 18, 18 C 17, 16, 18 D 16, 17, 18 Answer: B 2/4
Example 7-3a CLIMATE The average annual number of days of precipitation for selected cities in the Southwest is shown in the table below. Which measure of central tendency best describes the data? Must find the mean, median, and mode to answer question 3/4
Example 7-3a Add the columns Mean = sum of data pieces of data Count the number of pieces of data and put in the denominator 185 + 111 + 187 + 78 Mean = 11 Add the numerator Mean = 561 11 Bring down denominator Divide Mean = 51 3/4
Example 7-3a Median Order numbers from least to greatest 26, 32, 36, 36, 43, 52, 52, 59, 63, 72, 90 Count the pieces of data and divide by 2 11 divided by 2 = 5.5 Beginning at smallest number, underline 5 pieces of data Beginning at largest number, underline 5 pieces of data Circle the middle number Median = 52 3/4
Example 7-3a Mode Use the numbers from median that are ordered from least to greatest 26, 32, 36, 36, 43, 52, 52, 59, 63, 72, 90 Look for numbers that occur most often 36 and 52 occur twice and no others occur more often Mode = 36 and 52 3/4
Example 7-3b CLIMATE The average annual number of days of precipitation for selected cities in the Southwest is shown in the table below. Which measure of central tendency best describes the data? Mean = 51 Median = 52 Mode = 36 and 52 Since 51 and 52 appear in the middle of the set of data either could describe the data If the mode was only 52 it could be used, but 36 also as the mode separates the mode from the rest of the data Answer: Mean and median describes the data best 3/4
Example 7-3c WEIGHT The weights (in pounds) of nine sixth-grade boys are shown below. Which measure of central tendency best describes the data? Answer: The median of 79 best describes the data. 3/4
Example 7-4a Find the range of the data set 65, 68, 72, 65, 80, 55, 65. Then write a sentence describing how the data vary. Range = Greatest number - least number Greatest number ? Range = 80 Range = 80 - 55 Least number ? Range = 25 Subtract Answer: Range = 25. The range tells us that the data are fairly closely grouped together. 4/4
Example 7-4b * Find the range of the data set 25, 74, 48, 32, 61, 54. Then write a sentence describing how the data vary. Answer: Range = 49 The range shows the data are fairly spread out. 4/4
End of Lesson 7 Assignment