Download
1 / 26
270 likes | 425 Views
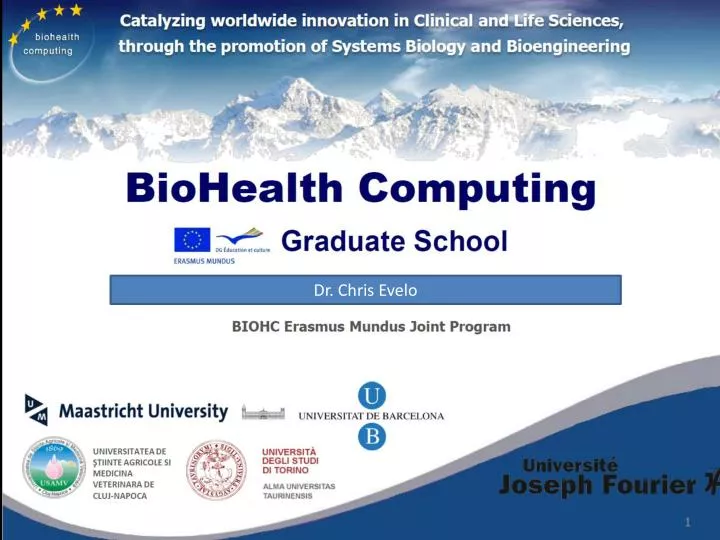
Dr. Chris Evelo. What we do at: (also read the comments). PathVisio. www.pathvisio.org. Visualize data on biological pathways It can use gene expression, proteomics and metabolomics data Identify significantly changed processes.

E N D
What we do at: (also read the comments)
PathVisio www.pathvisio.org • Visualize data on biological pathways • It can use gene expression, proteomics and metabolomics data • Identify significantly changed processes Martijn P van Iersel, Thomas Kelder, Alexander R Pico, Kristina Hanspers, Susan Coort, Bruce R Conklin, Chris Evelo (2008) Presenting and exploring biological pathways with PathVisio. BMC Bioinformatics 9: 399
Find the pathways:Biological processes in duodenal mucosa affected by glutamine administration
adding data =adding colour ExamplePathVisio result Showing proteomics and transcriptomics results on the glycolysis pathway in mice liverafter starvation. [Data from Kaatje Lenaerts and MilkaSokolovic, analysis by Martijn van Iersel]
dbNP Architecture Simple Assay module Body weight, BMI, etc. GSCF Query module Templates Full-text querying Templates Templates Transcriptomics module Groups Subjects Raw data cell files Structured querying Result data p-values z-values Clean data gene expression Pathways, GO, metabolite profiles Events Protocols Profile-based analysis Epigenetics module Samples Assays Study comparison Raw data Nimblegen Illumina Resulting Genome Feature data Clean CPG islanddata Web user interface
WikiPathways WikiPathways: Pathway Editing for the People. Alexander R. Pico, Thomas Kelder, Martijn P. van Iersel, Kristina Hanspers, Bruce R. Conklin, Chris Evelo. PLoS Biology2008: 6: 7. e184 Commentaries:Big data: Wikiomics. Mitch Waldrop. Nature 2008: 455, 22-25We the curators. Allison Doerr. Nature Methods 2008: 5, 754–755No rest for the bio-wikis. Ewen Callaway. Nature 2010: 468, 359-360 Public resource for biological pathways Anyone can contribute and curate More up-to-date representation of biological knowledge
PPS1Liver Cytoscape visualization used to group Pathways with high z-score grouped together. Explains why there are relatively few significant genes, but many pathways with high z-score. All pathways
Problem: Identifier Mapping Entrez Gene 3643 ? Affymetrix probeset 100234_at
BridgeDB: AbstractionLayer classIDMapperRdbrelational database interfaceIDMapper classIDMapperFiletab-delimitedtext classIDMapperBiomart web service
Finally connect genetics to genomics using modelling Gene/Protein Y Metabolite X TF • Pathways can serve as model visualizations (NCSB) • MIM and SBNG integration with EBI. • Quantified SNP functions can be model input RS00005 RS00002 Gene/Protein Z RS00001 RS00003 RS00004 mi999 Metabolite Y
“Bioinformatics to better understand biological data” wikipathways.org Data Integration arrayanalysis.org pathvisio.org
Contact Details Dr. Chris Evelo chris.evelo@maastrichtuniversity.nl Department of Bioinformatics – BiGCaT Maastricht University PO Box 616 NL 6200 MD Maastrich The Netherlands T: +31-43-3881231 M: +31-646705001 Skype: chris_evelo Web: www.bigcat.unimaas.nl CV: http://unimaas.academia.edu/ChrisEvelo Publications: www.publicationslist.org/chris_evelo Twitter: www.twitter.com/chris_evelo