Download
1 / 71
710 likes | 784 Views
The Cosmic Background at High l. Experimental Overview. Steven T. Myers. National Radio Astronomy Observatory Socorro, NM. The march of progress. Courtesy Wayne Hu – http://background.uchicago.edu. After WMAP…. Power spectrum measured to l < 1000 Primary CMB First 3 peaks.

E N D
The Cosmic Background at High l Experimental Overview Steven T. Myers National Radio Astronomy Observatory Socorro, NM
The march of progress Courtesy Wayne Hu – http://background.uchicago.edu
After WMAP… • Power spectrum • measured to l < 1000 • Primary CMB • First 3 peaks Courtesy Wayne Hu – http://background.uchicago.edu
…and Planck • Power spectrum • measured to l < 1000 • Primary CMB • First 6 peaks Courtesy Wayne Hu – http://background.uchicago.edu
Secondary Anisotropies Courtesy Wayne Hu – http://background.uchicago.edu
Gravitational Secondaries • Due to CMB photons passing through potential fluctuations (spatial and temporal) • Includes: • Early ISW (decay, matter-radiation transition at last scattering) • Late ISW (decay, in open or lambda model) • Rees-Sciama (growth, non-linear structures) • Tensors (gravity waves, ‘nuff said) • Lensing (spatial distortions) Courtesy Wayne Hu – http://background.uchicago.edu
CMB Lensing • Distorts the background temperature and polarization • Converts E to B polarization • Can reconstruct from T,E,B on arcminute scales • Can probe clusters Courtesy Wayne Hu – http://background.uchicago.edu
Scattering Secondaries • Due to variations in: • Density • Linear = Vishniac effect • Clusters = thermal Sunyaev-Zeldovich effect • Velocity (Doppler) • Clusters = kinetic SZE • Ionization fraction • Coherent reionization suppression • “Patchy” reionization
Vishniac Effect • Reionization + Structure • Linear regime • Second order (not cancelled) • aka Ostriker-Vishniac effect Courtesy Wayne Hu – http://background.uchicago.edu
Patchy Reionization • Structure in ionization • Can distinguish between ionization histories • Confusion, e.g. kSZ effect • e.g. Santos et al. (0305471) • Effects similar • kSZ, OV, PReI • Different z’s, use lensing?
2ndary SZE Anisotropies • Spectral distortion of CMB • Dominated by massive halos (galaxy clusters) • Low-z clusters: ~ 20’-30’ • z=1: ~1’ expected dominant signal in CMB on small angular scales • Amplitude highly sensitive to s8 A. Cooray (astro-ph/0203048) P. Zhang, U. Pen, & B. Wang (astro-ph/0201375)
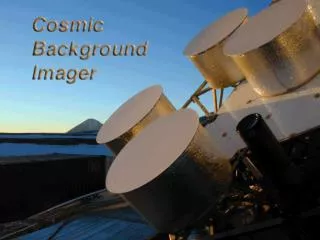
Experimental State of the Art • Sunyaev Zeldovich Array (SZA) • South Pole Telescope (SPT) • ACBAR • BIMA • BLAST • Green Bank Telescope / Penn Array • ALMA • CBI
The SZ Array & South Pole Telescope J. Carlstrom et al.
The SZA (Carlstrom) • 8 antennas, 3.5m diameter, 30 GHz • CARMA site in CA 6 x 10.4m OVRO 11 x 6m BIMA Combined array Courtesy J. Mohr - http://cosmology.astro.uiuc.edu/~jmohr/
SZE Surveys (e.g. SZA) • Exploit redshift-independence of SZE • Massive clusters – high bias, tail of distribution • Probe dark energy • Competing effects: • Volume vs. redshift • Growth of structure vs. redshift • Problems • Uncertain Mass/SZE relation • Redshifts • Confusion (w/CMB, lower mass objects) Courtesy J. Mohr - http://cosmology.astro.uiuc.edu/~jmohr/
South Pole Telescope (Carlstrom) • 8 meter telescope, off-axis • 1027 element bolometer arrays • @ 90, 150, 217, 270 GHz • Survey 4000 sq. deg with 1.3’ pixels at 150 GHz • Spiderweb TES bolometers (Adrian Lee) Courtesy J. Mohr - http://cosmology.astro.uiuc.edu/~jmohr/
The Arcminute Cosmology Bolometer Array Receiver U.C. Berkeley: W.L. Holzapfel (co-PI) M.D. Daub C.L. Kuo M. Lueker M. Newcomb D. Woolsey C. Cantalupo Case-Western: J. Ruhl (co-PI) J. Leong Caltech: A.E. Lange C. Reichardt M.C. Runyan UCSB: J. Goldstein E. Torbet CMU: P. Gomez J.B. Peterson A.K. Romer Cardiff: P.A.R. Ade C.V. Haynes C. Tucker JPL: J.J. Bock A.D. Turner ESA: R.S. Bhatia G.I. Sirbi ACBAR is funded by the NSF Office of Polar Programs
Overview of ACBAR: ACBAR Instrument • 16-pixel, multi-frequency, 240 mK, millimeter-wave bolometer array. • Observes from 2m Viper telescope at the South Pole with 4-5 beams. 2002 Winter Crew • Bands, filters, detectors, and angular resolution similar to Planck HFI. • Assembled: Fall 2000 • Installed: January 2001 • Upgraded: December 2001 • Observed through Nov 2002
Thermal SZ (y=10-4) Frequency Bands: Configurable to observe simultaneously at: Bands located at peak intensity of CMB anisotropies and across the SZ thermal null. 0 150 GHz 30 GHz (20%) 220 GHz 30 GHz (14%) 280 GHz 50 GHz (18%) 350 GHz 24 GHz (7%) 100 K CMB Avoids foregrounds: • Dust • Radio sources • Atmosphere Model of SP atmospheric transmission
Viper Telescope: 2m off-axis Gregorian Skirt reflects primary spill-over to sky. Chopping flat at image of primary formed by secondary Ground shield blocks emission from EL< 25º. Panel lowers for low-EL observations Large AZ chop (~3°) + small beams (~4-5) = broad -space coverage (~75 to 3000)
Beams and Calibration: 2002: Venus band FWHM 150 GHz 4.8 220 GHz 4.0 280 GHz 4.0 350 GHz 5.7 2001: Mars band FWHM 150 GHz 4.7 220 GHz 4.2 280 GHz 3.9
2001 & 2002 Observations: (Finkbeiner, Davis, & Schlegel, 1999) 150 GHz Dust Model Centered fields on mm-bright point sources. Each field is ~18 deg2. Point source provides monitor of pointing and beams. Coadded point source image includes beam size and pointing jitter. FIELD (PMN object) RA (J2000) DEC Time (d) 150/beam CMB2 (J0455-4616) 73.962 -46.266 39 ~9K CMB5 (J0253-5441) 43.372 -54.698 109 ~5K CMB6 (J0210-5101) 32.692 -51.017 23 — CMB7 (J2235-4835) 338.805 -48.600 21 —
CMB2 Field (~10 deg2) Mostly from 2001 Temperature Map 150 GHz Lead/Main/Trail Subtracted to Remove Scan Synchronous Offsets Noise Map S/N~40 on degree scale structure
CMB5 Field Winter 2002 Highest S/N Map of the CMB to date S/N~100 On degree scale structure
LBNL-NERSC Supercomputer tackles • number crunching • ACBAR Power spectrum before/after foreground subtraction • IRAS Dust Template • 102(CMB2)+68(CMB5) PMN Radio Sources
Kuo et al. astro-ph/ 0212289 Sample Variance dominated Noise Dominated ACBAR VS. the World Pre-WMAP
First ACBAR Cluster Image: A3266 z=.0545 Tx=6.2 keV Lx=9.5x1044 Requires Multi-frequency Data to Subtract CMB
ACBAR So Far: • Completed 2nd year of observations. • Instrument performing well and meeting specifications. • Power spectrum and cosmological parameters based on two fields just released (astro-ph/0212289, 0212517). • Analysis of power spectrum from two times more sky underway. • Deep pointed observations of the nine brightest REFLEX clusters accessible from the Pole. • Analysis of pointed SZ cluster observations and SZ cluster search is in progress.
Future Plans for ACBAR: 2003: 2004: 1/2 year with instrument unchanged from 2002 configuration. More sky coverage and more clusters. • Reconfigure focal plane to match mapping sensitivities at 150 and 220 GHz. Separate primary CMB and SZ! • Measure SZ power spectrum • Improve ability to find unknown SZ clusters in blank fields.
BIMA W. Holzapfel, J. Carlstrom
BIMA Survey of Arcminute Scale CMB Anisotropy
BIMA Observations 9 Telescopes in Compact Array 28.5 GHz Observing Frequency 6.6’ FWHM ~150 μJy/beam RMS (u-v < 1.1 kλ) 15 μK for 2’ Synthesized Beam
CL 0016+16, z = 0.55 X-Ray SZE: = 15 K, contours =2
Sample from 60 OVRO/BIMA imaged clusters, 0.07 < z < 1.03
BIMA Blank Field Survey BDF3 Time ~60 hours u-v =1.1-1.7 kl, Beam=18”X25” RMS ~ 150mJy/beam u-v = 0.63-1.1 kl, Beam=99”X116” RMS ~ 150mJy/beam ~ 15mK • Now have 18 fields • Of comparable depth • Selected for low dust • contrast.
VLA Observations • Identify Radio Point Source Contaminants with Deep Observations at 4.8 GHz • 1.5 hrs per Field, All 10 fields have been imaged • ~25 μJy/beam RMS, 9’ FWHM beam • 6s source positions used to project out in covariance matrix
Comparison with Models for SZ power Spectrum Includes sample variance Statistical error only Dawson et al. ApJ 581, 86D 2002
Cosmological Constraints Komatsu, 2002.
Summary 1. Observations with the BIMA array have resulted in a significant detection of excess power on the scales at which the SZ effect is expected to dominate 2. The measured anisotropy is consistent with a σ8 = 0.9-1.0 cosmology. 3. Analysis of the BIMA image statistics and follow-up optical observations are in progress to determine the source of the excess power. http://cosmology.berkeley.edu/group/swlh/bima_anisotropy/index.html
BLAST Balloon-borneLargeAperture SubmillimeterTelescope University of Toronto University of British Columbia INAOE – Mexico Cardiff University University of Pennsylvania Brown University University of Miami JPL
The Sub-millimeter Background is Largely Unexplored Territory
BLASTTelescope and Detector Parameters State-of-the-art detectors SPIRE assembly LDB flight Compact arrays High-altitude telescope JPL Spiderweb bolometers
BLAST Telescope and Detectors Combine to Give Impressive Mapping Capabilities BLASTArray Coverage 6.5 X 13 arcmin Simulated Sky at 250 microns Smoothed toBLASTBeams
The Star Formation History of the Universe BLAST will make maps of the sub-millimeter sky covering 1-10 sq. deg. Steidel 2000
Star Formation History Steidel Madau Lilly (SCUBA) Compilation from Blain 2002