Download
1 / 42
430 likes | 724 Views
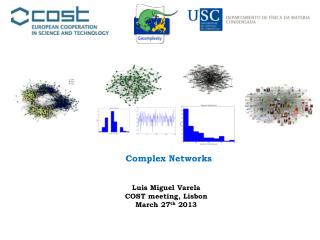
Measuring Properties of Complex Networks. Lecture 3. Slides by Panayiotis Tsaparas. Types of networks. Social networks Knowledge (Information) networks Technology networks Biological networks. Social Networks. Links denote a social interaction Networks of acquaintances

E N D
Measuring Properties of Complex Networks Lecture 3 Slides by Panayiotis Tsaparas
Types of networks • Social networks • Knowledge (Information) networks • Technology networks • Biological networks
Social Networks • Links denote a social interaction • Networks of acquaintances • collaboration networks • actor networks • co-authorship networks • director networks • phone-call networks • e-mail networks • IM networks • Bluetooth networks • sexual networks • home page/blog networks
Knowledge (Information) Networks • Nodes store information, links associate information • Citation network (directed acyclic) • The Web (directed) • Peer-to-Peer networks • Word networks • Networks of Trust • Software graphs
Technological networks • Networks built for distribution of commodity • The Internet • router level, AS level • Power Grids • Airline networks • Telephone networks • Transportation Networks • roads, railways, pedestrian traffic
Biological networks • Biological systems represented as networks • Protein-Protein Interaction Networks • Gene regulation networks • Gene co-expression networks • Metabolic pathways • The Food Web • Neural Networks
Measuring Networks • Degree distributions • Small world phenomena • Clustering Coefficient • Mixing patterns • Degree correlations • Communities and clusters
The basic random graph model • The measurements on real networks are usually compared against those on “random networks” • The basic Gn,p(Erdös-Renyi) random graph model: • n : the number of vertices • 0 ≤ p ≤ 1 • for each pair (i,j), generate the edge (i,j)independently with probability p
Degree distributions • Problem: find the probability distribution that best fits the observed data frequency fk = fraction of nodes with degree k = probability of a randomly selected node to have degree k fk k degree
Power-law distributions • The degree distributions of most real-life networks follow a power law • Right-skewed/Heavy-tail distribution • there is a non-negligible fraction of nodes that has very high degree (hubs) • scale-free: no characteristic scale, average is not informative • In stark contrast with the random graph model! • Poisson degree distribution, z=np • highly concentrated around the mean • the probability of very high degree nodes is exponentially small p(k) = Ck-α
Power-law signature • Power-law distribution gives a line in the log-log plot • α : power-law exponent (typically 2 ≤ α≤ 3) log p(k) = -α logk + logC α log frequency frequency log degree degree
Examples Taken from [Newman 2003]
Exponential distribution • Observed in some technological or collaboration networks • Identified by a line in the log-linear plot p(k) = λe-λk log p(k) = - λk + log λ log frequency λ degree
Average/Expected degree • For random graphs z = np • Forpower-law distributed degree • if α ≥ 2, it is a constant • if α < 2, it diverges
Maximum degree • For random graphs, the maximum degree is highly concentrated around the average degree z • For power law graphs • Rough argument: solve nP[X≥k]=1
Clustering (Transitivity) coefficient • Measures the density of triangles (local clusters) in the graph • Two different ways to measure it: • The ratio of the means
Example 1 4 3 2 5
Clustering (Transitivity) coefficient • Clustering coefficient for node i • The mean of the ratios
Example • The two clustering coefficients give different measures • C(2) increases with nodes with low degree 1 4 3 2 5
Clustering coefficient for random graphs • The probability of two of your neighbors also being neighbors is p, independent of local structure • clustering coefficient C = p • when z is fixed C = z/n =O(1/n)
The C(k) distribution • The C(k) distribution is supposed to capture the hierarchical nature of the network • when constant: no hierarchy • when power-law: hierarchy C(k) = average clustering coefficient of nodes with degree k C(k) k degree
Millgram’s small world experiment • Letters were handed out to people in Nebraska to be sent to a target in Boston • People were instructed to pass on the letters to someone they knew on first-name basis • The letters that reached the destination followed paths of length around 6 • Six degrees of separation:(play of John Guare) • Also: • The Kevin Bacon game • The Erdös number • Small world project: http://smallworld.columbia.edu/index.html
Measuring the small world phenomenon • dij = shortest path between i and j • Diameter: • Characteristic path length: • Harmonic mean • Also, distribution of all shortest paths
Is the path length enough? • Random graphs have diameter • d=logn/loglogn when z=ω(logn) • Short paths should be combined with other properties • ease of navigation • high clustering coefficient
Degree correlations • Do high degree nodes tend to link to high degree nodes? • Pastor Satoras et al. • plot the mean degree of the neighbors as a function of the degree
Degree correlations • Newman • compute the correlation coefficient of the degrees of the two endpoints of an edge • assortative/disassortative
Connected components • For undirected graphs, the size and distribution of the connected components • is there a giant component? • For directed graphs, the size and distribution of strongly and weakly connected components
Network Resilience • Study how the graph properties change when performing random or targeted node deletions
Graph eigenvalues • For random graphs • semi-circle law • For the Internet (Faloutsos3)
Motifs • Most networks have the same characteristics with respect to global measurements • can we say something about the local structure of the networks? • Motifs: Find small subgraphs that over-represented in the network
Example • Motifs of size 3 in a directed graph
Finding interesting motifs • Sample a part of the graph of size S • Count the frequency of the motifs of interest • Compare against the frequency of the motif in a random graph with the same number of nodes and the same degree distribution
Generating a random graph • Find edges (i,j) and (x,y) such that edges (i,y) and (x,j) do not exist, and swap them • repeat for a large enough number of times j j i i y y x x degrees of i,j,x,y are preserved G G-swapped
The feed-forward loop • Over-represented in gene-regulation networks • a signal delay mechanism X Y Z Milo et al. 2002
Families of networks • Compute the relative frequency of different motifs, and group the networks if they exhibit similar frequencies
Experiments Milo et al. 2004
References • M. E. J. Newman, The structure and function of complex networks, SIAM Reviews, 45(2): 167-256, 2003 • R. Albert and A.-L. Barabási, Statistical mechanics of complex networks, Reviews of Modern Physics 74, 47-97 (2002). • S. N. Dorogovstev and J. F. F. Mendez, Evolution of Networks: From Biological Nets to the Internet and WWW. • Michalis Faloutsos, Petros Faloutsos and Christos Faloutsos. On Power-Law Relationships of the Internet Topology. ACM SIGCOMM 1999. • E. Ravasz, A. L. Somera, D. A. Mongru, Z. N. Oltvai, and A.-L. Barabási, Hierarchical organization of modularity in metabolic networks, Science 297, 1551-1555 (2002). • R Milo, S Shen-Orr, S Itzkovitz, N Kashtan, D Chklovskii & U Alon, Network Motifs: Simple Building Blocks of Complex Networks. Science, 298:824-827 (2002). • R Milo, S Itzkovitz, N Kashtan, R Levitt, S Shen-Orr, I Ayzenshtat, M Sheffer & U Alon, Superfamilies of designed and evolved networks. Science, 303:1538-42 (2004).