Download
1 / 21
210 likes | 220 Views
Explore consumer rights confidence, service satisfaction levels, and likely actions post good/bad service in this Market Research Report from March 2012 by the National Consumer Agency. Detailed analysis of empowerment and service experience.

E N D
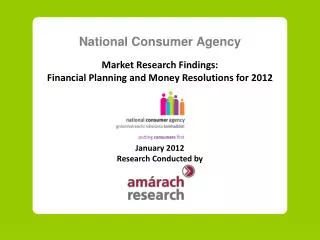
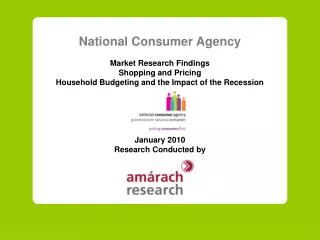
National Consumer Agency Market Research Findings: Consumer Empowerment and Customer Service March 2012 Research Conducted by
Key Findings Section 1: Consumer Empowerment Section 2: Customer Service Research Background and Methodology Profile of Sample Table of Contents
Key Findings • Consumer Rights • 77% state they are confident of their rights (↓1% point) • 72% assert they are knowledgeable of their rights (↑1% point) • 76% feel protected in respect of their rights (↑5% points) • Customer Service • Supermarkets and shops selling clothing or footwear had the highest level of satisfaction with customer service, both at 91%. • The lowest level of satisfaction, at 64%, applied to those contacting airlines’ customer service, airlines also had the highest proportion claiming dissatisfaction at 30%. • Nearly 3 in 5 (57%) consumers state that as a result of receiving bad customer service they would stop doing business with a provider.
Confidence about Rights as a Consumer (Base: All aged 15-74 – 1,000)
Knowledge about Consumer Rights (Base: All aged 15-74 – 1,000)
Protected Regarding Consumer Rights (Base: All aged 15-74 – 1,000)
Empowerment Levels x Profile of Sample (Base: All aged 15-74 – 1,000) = Significantly higher than total sample = Significantly lower than total sample
Experience with Customer Service – I (Base: All that have purchased goods services from each sector within the past 12 months) Contact with Customer Service Method of Contact Shops Selling Clothing or Footwear (Base: 941) Supermarkets (Base: 932) Communication Services e.g. Home phone, mobile, broadband (Base: 807) Banking Products and Services (Base: 758) Insurance Products & Services (Base: 692) Energy Suppliers (Base: 695)
Experience with Customer Service – II (Base: All that have purchased goods services from each sector within the past 12 months) Contact with Customer Service Method of Contact TV Service Provider (Base: 628) Waste Services (Base: 592) Bus & Train Transport (Base: 471) Airlines (Base: 450) Shops Selling Furniture & Household Appliances (Base: 405) * Caution small base size
Satisfaction with Customer Service – I (Base: All that had contact with customer service) Very dissatisfied (1) Very satisfied (5) (2) (4) 91% 91% 83% 83% 70% 76%
Satisfaction with Customer Service – II (Base: All that had contact with customer service) Very dissatisfied (1) Very satisfied (5) (2) (4) 75% 75% 71% 70% 64% 30% * Caution small base size
Likely Action as a Result of Good & Bad Customer Service (Base: All aged 15-74 – 1,000) Bad customer service Good customer service % %
Research Background and Methodology • The research was conducted by means of face-to-face interviewing with 1,000 people between the ages of 15-74. • To ensure that the data is nationally representative, quotas were applied on the basis of age, gender and social class. • Interviewing was conducted over a four week period in November 2011. Nov/Dec 2007 Aug 2008 Nov/Dec 2008 May/June 2009 Benchmark Wave 1 Wave 2 Wave 3 Nov/Dec 2009 Nov/December 2010 May/June 2011 June 2010 Wave 4 Wave 5 Wave 6 Wave 7 Nov 2011 Current Wave Wave 8
Profile of Sample - I (Base: All aged 15-74 – 1,000) MAIN GROCERY SHOPPER % % % % 15-24 Dublin Male ABC1 F50+ Yes No 25-34 Rest of Leinster 35-44 45-54 Munster Female C2DE F50- 55+ Conn/ Ulster
Profile of Sample – II – Main Grocery Shoppers (Base: All Mainly Responsible for Grocery Shopping in Home – 526) % % % % 15-24 (17) Male (49) Dublin (28) 25-34 (22) ABC1 F50+ (48) Rest of Leinster (26) 35-44 (19) 45-54 (16) Female (51) Munster (28) C2DE F50- (52) 55+ (26) Conn/ Ulster (18) ( ) = Total Sample
Profile of Sample – III – Internet Use (Base: All aged 15-74 – 1,000) USE INTERNET EVER PURCHASED ONLINE BANKING ONLINE (Base: All Internet Users - 762) (Base: All Internet Users - 762) (25%) Yes Yes Yes (30%) No No No (51%) (49%) (70%) (75%) % Yes % Yes % Yes () = June 2011
Profile of Sample – IV – Social Media (Base: All aged 15-74 – 1,000) Nov 2011 June 2011 Higher Amongst Type of phone % Regular users of ....... % 15-24 86% ABC1F50 59% Dublin 55% (21) Have a ‘Smart phone’ 15-24 21% 55+ 86% C2DEF50- 56% Munster 53% () = June 2011